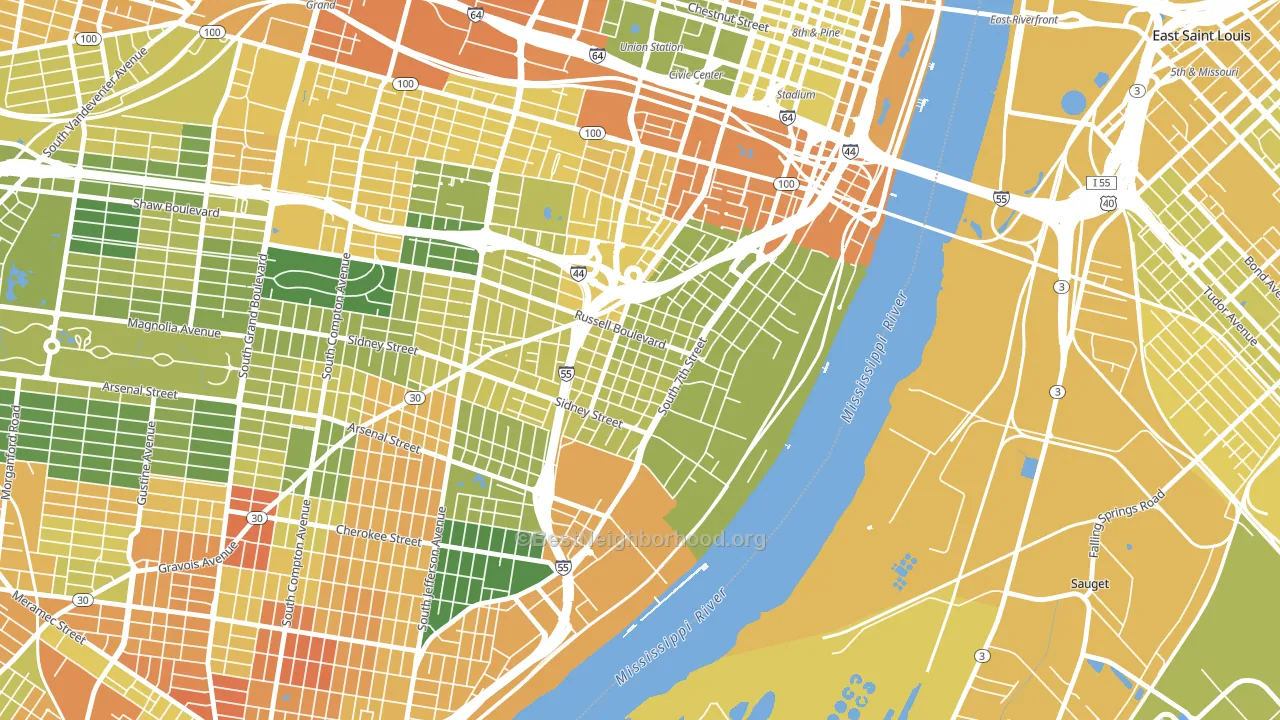
Soulard is a Democratic stronghold. About 82% of voters here vote Democratic and 18% Republican.
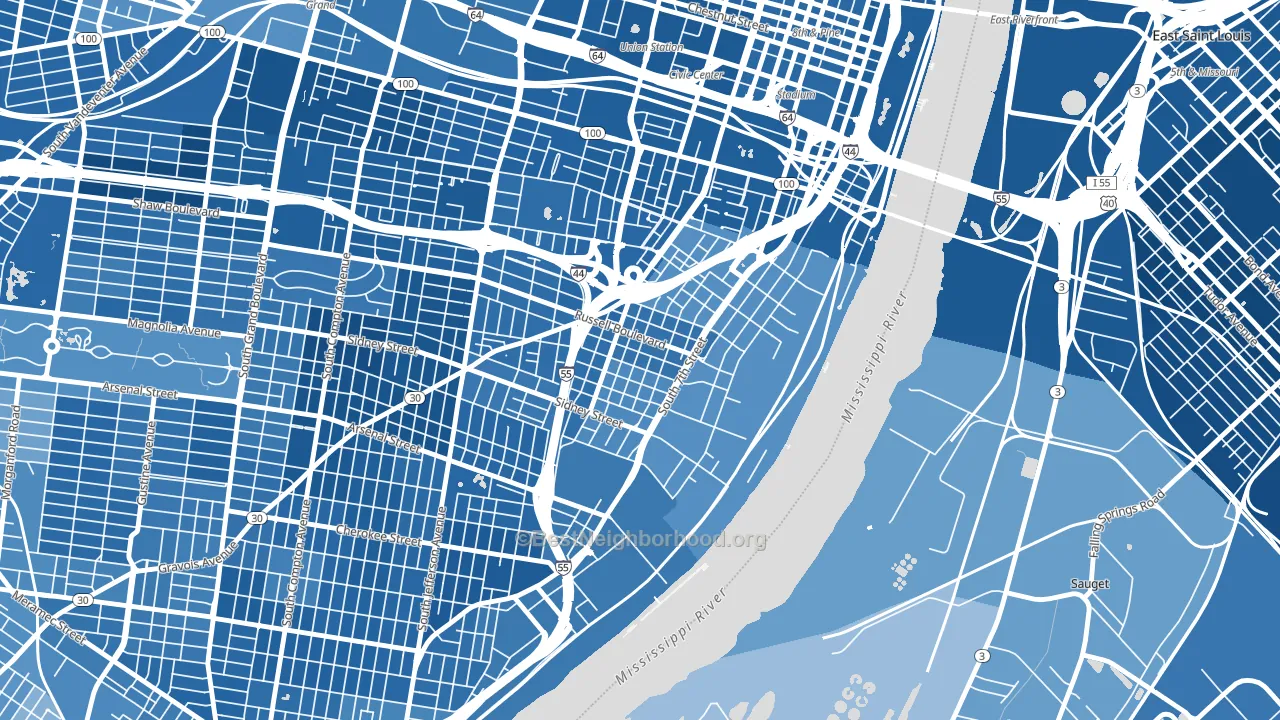
About 65% of adults in Soulard typically vote, near the U.S. average of about 62%. Among adults in Soulard, ~53% vote Democratic, ~12% Republican, and ~35% don't vote. The map below shows estimated turnout by block group.
How Soulard compares
Among neighborhoods within 5 miles, Soulard leans more Democratic than 11 of 28 neighbors.
Soulard runs about 83 points more Democratic than Missouri as a whole. Missouri leans Republican overall, while Soulard is one of the few Democratic-leaning pockets.
Why Soulard leans the way it does
This analysis examined 14,881 data points per neighborhood to find what predicts political lean and turnout. The items below are a few correlations that stood out for Soulard, not a ranked or complete list of what matters most.
Soulard votes against the grain of Missouri. Missouri leans Republican overall, while Soulard runs about 83 points more Democratic. A high never-married share predicts Democratic voting, and about 58% of adults in Soulard have never been married, above 92% of neighborhoods.
Walkability and Democratic lean
Places with a highly walkable street grid tend to lean Democratic; Soulard, St. Louis, MO sits in the top tenth nationally on this measure. A walkable street grid does not change how people vote; it mostly reflects how urban a place is.
Why turnout in Soulard looks the way it does
Turnout in Soulard sits close to the national pattern. Learn more about the findings and methodology on the political spectrum map.
Nearby Neighborhoods
- Benton Park, St. Louis, MO D+74
- The Gate District, St. Louis, MO D+75
- Benton Park West, St. Louis, MO D+74
- Tower Grove East, St. Louis, MO D+76
- Downtown West, St. Louis, MO D+71
- Gravois Park, St. Louis, MO D+72
- Downtown, St. Louis, MO D+67
- Shaw, St. Louis, MO D+75
- Midtown St. Louis, St. Louis, MO D+71
- Tower Grove South, St. Louis, MO D+65
Neighborhoods with Similar Populations
- Creekstone, Kennewick, WA R+28
- East Village, San Antonio, TX D+22
- Frye Circle, Andover, MA D+42
- Downtown Nashua, Nashua, NH D+31
- Troutman Park, Fort Collins, CO D+32
- Limberlost, Tucson, AZ D+33
- Wellshire, Denver, CO D+49
- Newton Square, Worcester, MA D+31
- Stablewood-Valley Hi North-Houston, Cypress, TX R+24
- Woodbine, Sacramento, CA D+37
Sources and methodology
Precinct-level voting records used to fit the model come from Missouri Secretary of State, Elections, distributed by the Voting and Election Science Team. Demographic inputs come from the U.S. Census Bureau (ACS 5-year estimates and the 2020 Decennial Census). Health and environmental inputs come from the CDC (PLACES and the Environmental Justice Index). Land cover comes from the USGS and EPA. Election-day and lead-up weather come from PRISM 4km daily grids and the NOAA Global Historical Climatology Network. Mail-voting and election-administration patterns come from the MIT Election Lab's Survey of the Performance of American Elections. Block-group crime detail comes from CrimeGrade. Internet data and modeling support provided by ISPreports.org.
Modeling and analysis by the BestNeighborhood data science team. Full methodology and findings: political spectrum map.
Methodology reviewed by the BestNeighborhood data team. Last updated May 2026.