Bridgetown North leans Republican by roughly 26 points: about 37% of voters vote Democratic and 63% Republican.
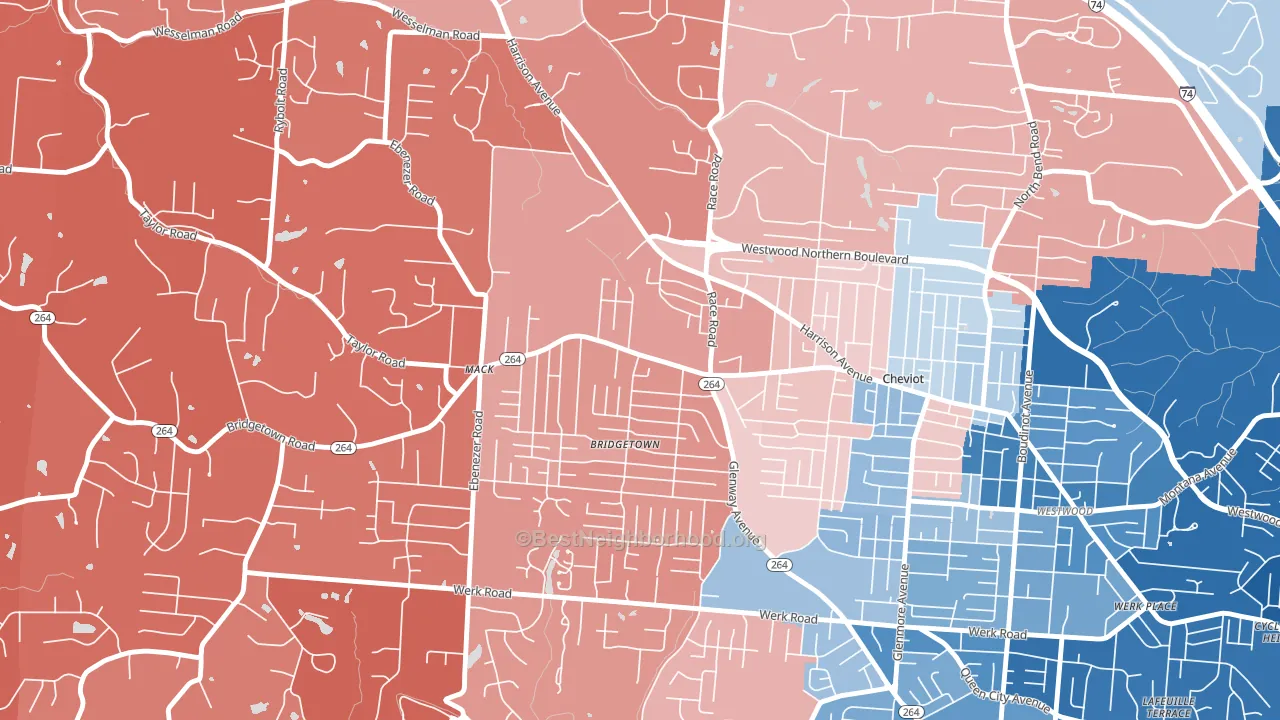
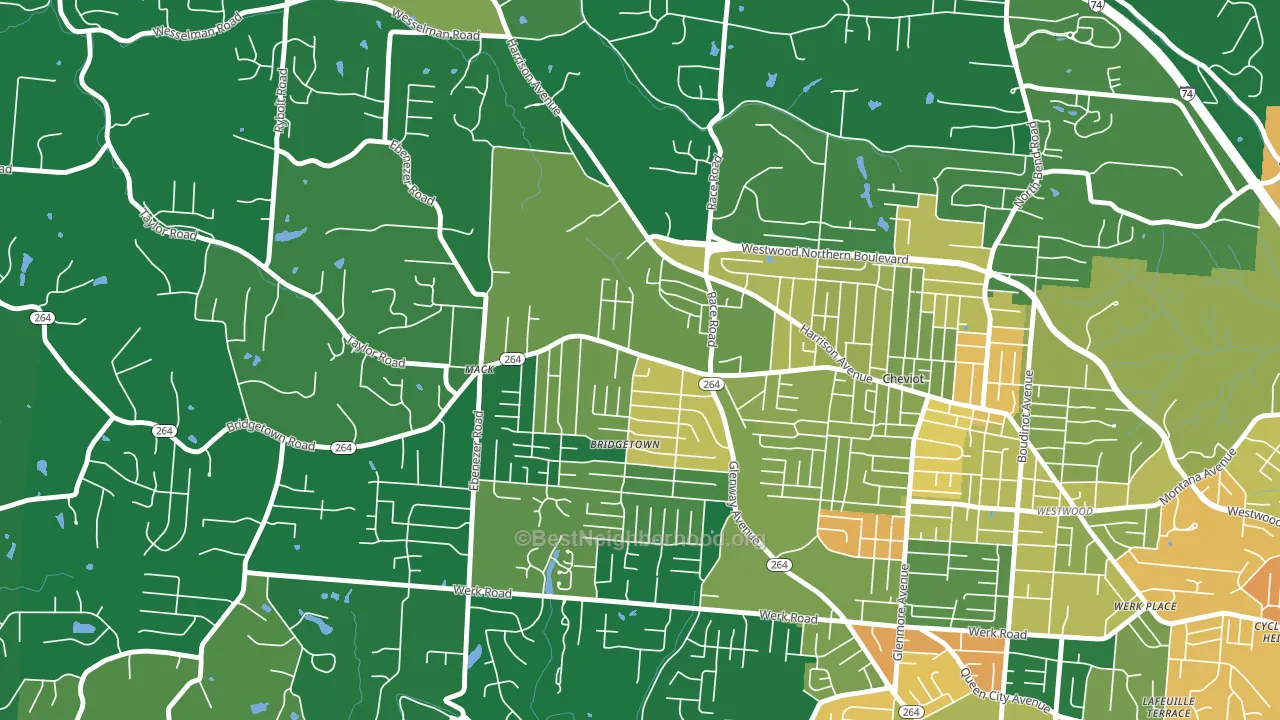
About 84% of adults in Bridgetown North typically vote, above the U.S. average of about 62%. Among adults in Bridgetown North, ~31% vote Democratic, ~53% Republican, and ~16% don't vote. The map below shows estimated turnout by block group.
How Bridgetown North compares
Among neighborhoods within 5 miles, Bridgetown North leans more Republican than 7 of 8 neighbors.
Bridgetown North runs about 15 points more Republican than Ohio as a whole.
Politics vary noticeably by block within Bridgetown North. The west side is the most Republican-leaning (R+31) and the southeast side is the least Republican-leaning (R+7), a spread of about 24 points.
Why Bridgetown North leans the way it does
Density, race composition, education, and family structure all sit close to their national averages in Bridgetown North. The lean here lands roughly where demographic data alone would predict.
Cancer-screening access and voter turnout
Places with high colon-cancer-screening access tend to turn out at a higher rate; Bridgetown North, Cincinnati, OH sits above the national average on this measure. Cancer screening does not drive turnout; it reflects income, insurance, and healthcare access.
Why turnout in Bridgetown North looks the way it does
Homeowners vote more often than renters. About 86% of households in Bridgetown North own their home, about 9 points above the Ohio average of 77%. Learn more about the findings and methodology on the political spectrum map.
Nearby Neighborhoods
- Mack South, Cincinnati, OH R+51
- Monfort Heights South, Cincinnati, OH R+24
- Westwood, Cincinnati, OH D+46
- West Price Hill, Cincinnati, OH D+23
- East Westwood, Cincinnati, OH D+80
- Mount Airy, Cincinnati, OH D+58
- Sayler Park, Cincinnati, OH R+18
- South Fairmount, Cincinnati, OH D+54
- Northside, Cincinnati, OH D+68
- East Price Hill, Cincinnati, OH D+36
Neighborhoods with Similar Populations
- Northwest, Garden City, ID Even
- Friendly, Eugene, OR D+70
- Hutton Park, West Orange, NJ D+61
- Locks, Chicago, IL D+30
- Logan, Ann Arbor, MI D+62
- Downtown San Mateo, San Mateo, CA D+55
- Sovana, Spring Valley, NV D+15
- Latah Valley, Spokane, WA D+12
- Berkeley Place, Martinsburg, WV R+4
- Curtis, Highland, CA D+22
Sources and methodology
Precinct-level voting records used to fit the model come from Ohio Secretary of State, Elections, distributed by the Voting and Election Science Team. Demographic inputs come from the U.S. Census Bureau (ACS 5-year estimates and the 2020 Decennial Census). Health and environmental inputs come from the CDC (PLACES and the Environmental Justice Index). Land cover comes from the USGS and EPA. Election-day and lead-up weather come from PRISM 4km daily grids and the NOAA Global Historical Climatology Network. Mail-voting and election-administration patterns come from the MIT Election Lab's Survey of the Performance of American Elections. Block-group crime detail comes from CrimeGrade. Internet data and modeling support provided by ISPreports.org.
Modeling and analysis by the BestNeighborhood data science team. Full methodology and findings: political spectrum map.
Methodology reviewed by the BestNeighborhood data team. Last updated May 2026.