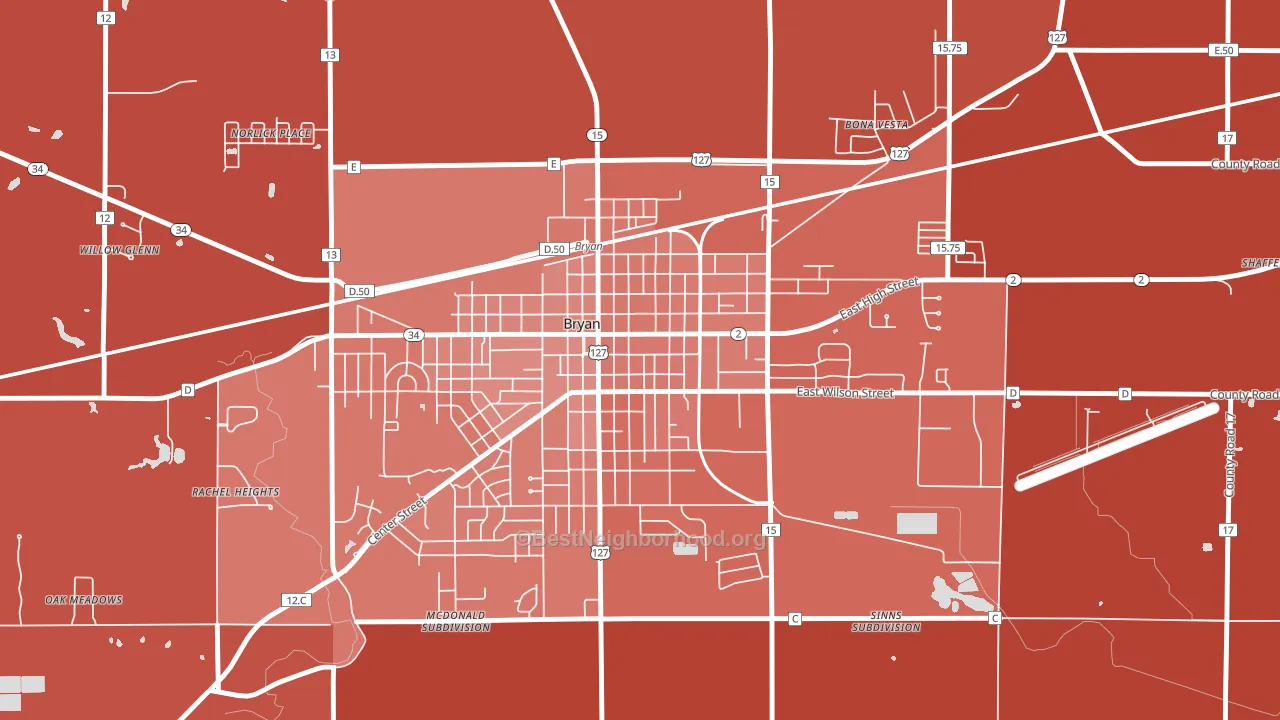
Bryan Downtown Historic District leans heavily Republican by roughly 30 points: about 35% of voters vote Democratic and 65% Republican.
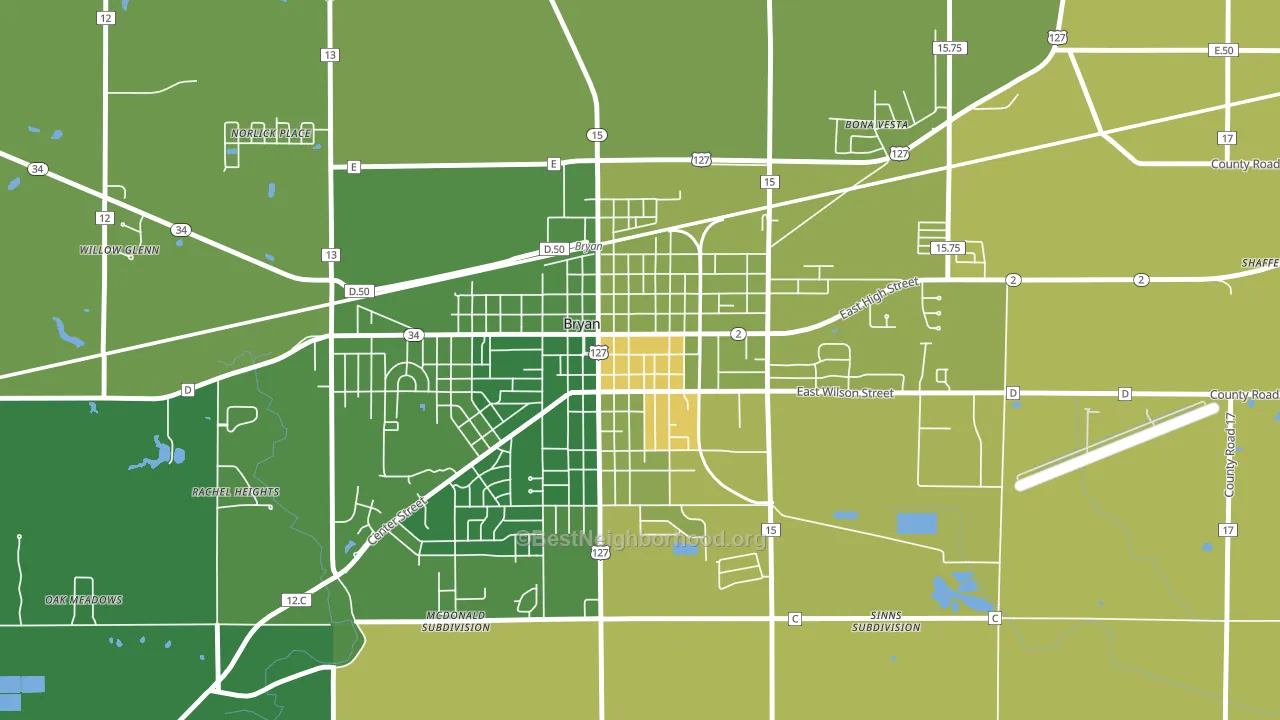
About 73% of adults in Bryan Downtown Historic District typically vote, above the U.S. average of about 62%. Among adults in Bryan Downtown Historic District, ~26% vote Democratic, ~47% Republican, and ~27% don't vote. The map below shows estimated turnout by block group.
How Bryan Downtown Historic District compares
Bryan Downtown Historic District runs about 19 points more Republican than Ohio as a whole.
Why Bryan Downtown Historic District leans the way it does
This analysis examined 14,881 data points per neighborhood to find what predicts political lean and turnout. The items below are a few correlations that stood out for Bryan Downtown Historic District, not a ranked or complete list of what matters most.
Areas with a high white share and below-average college attainment vote Republican. In Bryan Downtown Historic District, about 92% of residents are non-Hispanic white, about 19 points above the U.S. average of 72%; about 13% of adults hold a bachelor's degree, about 11 points below the Ohio average of 23%.
Housing overcrowding and voter turnout
Places with low overcrowding tend to turn out at a higher rate; Bryan Downtown Historic District, Bryan, OH sits in the bottom quarter nationally on this measure.
Why turnout in Bryan Downtown Historic District looks the way it does
Turnout in Bryan Downtown Historic District sits close to the national pattern. Learn more about the findings and methodology on the political spectrum map.
Nearby Neighborhoods
- Holgate Avenue Historic District, Defiance, OH R+28
- Arlington Park, Fort Wayne, IN R+19
- Canterbury Green, Fort Wayne, IN D+21
- Northside, Fort Wayne, IN D+17
- Bloomingdale, Fort Wayne, IN D+3
- Oxford, Fort Wayne, IN D+67
- West Central, Fort Wayne, IN D+31
- Pettit-Rudisill, Fort Wayne, IN D+61
- Southwyck, Toledo, OH D+35
- Maumee Uptown Historic District, Maumee, OH D+4
Neighborhoods with Similar Populations
- Galeville, Liverpool, NY D+16
- University Pines, Lubbock, TX R+27
- Richmond Grove, Sacramento, CA D+66
- Paradise Park, Savannah, GA D+29
- Indian River Park, Mims, FL R+54
- Lake Hollingsworth, Lakeland, FL R+19
- Harrison, Minneapolis, MN D+67
- Rio Grande Park, Orlando, FL D+49
- Seneca, Buffalo, NY D+6
- Westinghouse, Charlotte, NC D+51
Sources and methodology
Precinct-level voting records used to fit the model come from Ohio Secretary of State, Elections, distributed by the Voting and Election Science Team. Demographic inputs come from the U.S. Census Bureau (ACS 5-year estimates and the 2020 Decennial Census). Health and environmental inputs come from the CDC (PLACES and the Environmental Justice Index). Land cover comes from the USGS and EPA. Election-day and lead-up weather come from PRISM 4km daily grids and the NOAA Global Historical Climatology Network. Mail-voting and election-administration patterns come from the MIT Election Lab's Survey of the Performance of American Elections. Block-group crime detail comes from CrimeGrade. Internet data and modeling support provided by ISPreports.org.
Modeling and analysis by the BestNeighborhood data science team. Full methodology and findings: political spectrum map.
Methodology reviewed by the BestNeighborhood data team. Last updated May 2026.