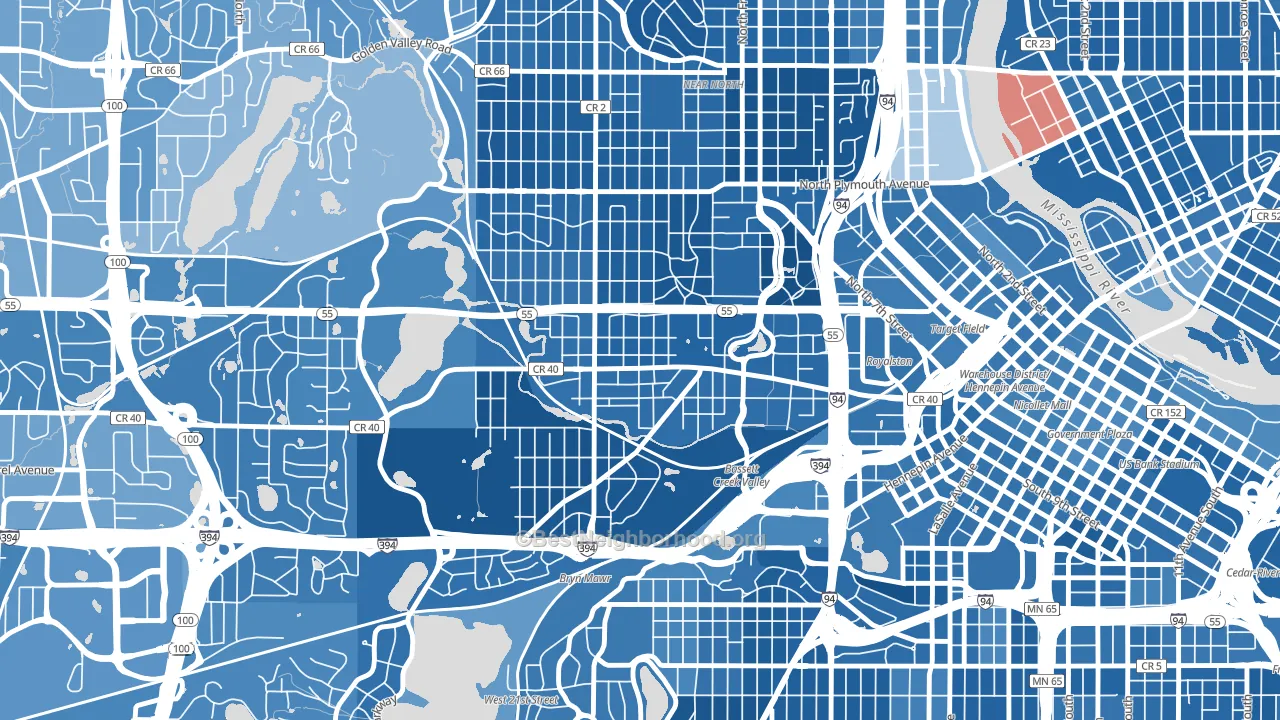
Harrison is a Democratic stronghold. About 83% of voters here vote Democratic and 17% Republican.
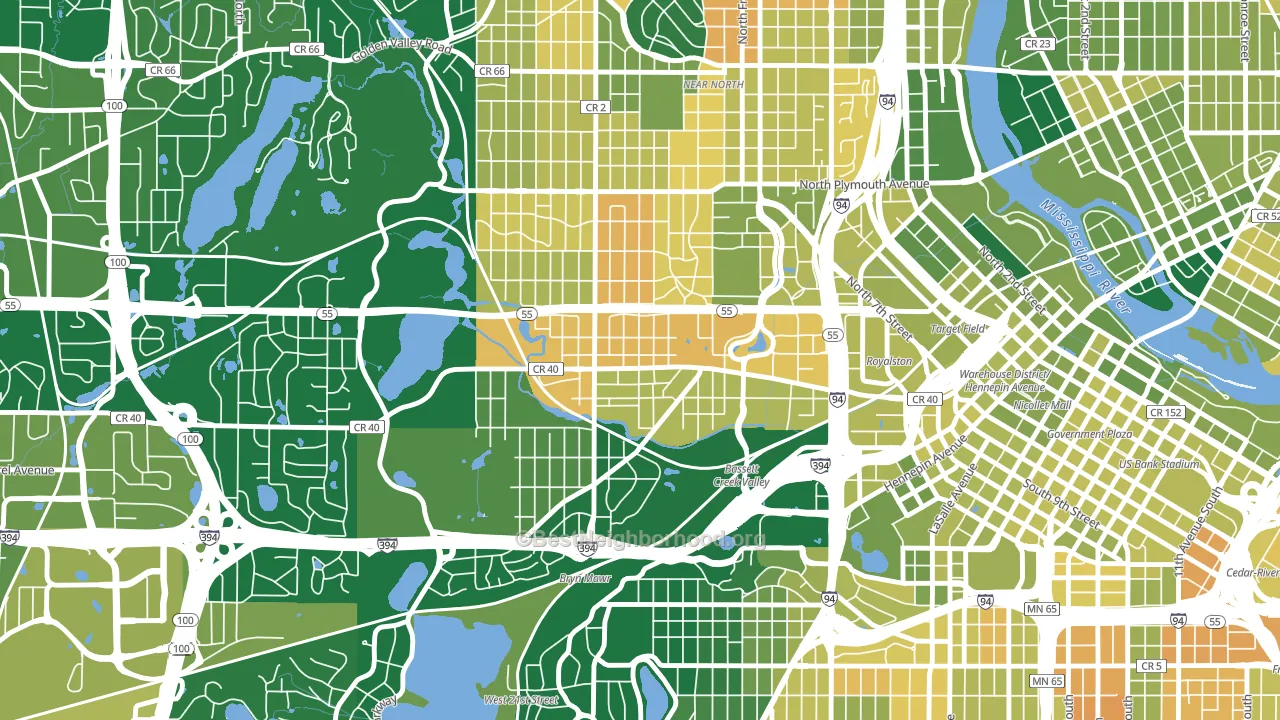
About 48% of adults in Harrison typically vote, below the U.S. average of about 62%. Among adults in Harrison, ~40% vote Democratic, ~8% Republican, and ~52% don't vote. The map below shows estimated turnout by block group.
How Harrison compares
Among neighborhoods within 5 miles, Harrison leans more Democratic than 22 of 48 neighbors.
Harrison runs about 62 points more Democratic than Minnesota as a whole.
Why Harrison leans the way it does
This analysis examined 14,881 data points per neighborhood to find what predicts political lean and turnout. The items below are a few correlations that stood out for Harrison, not a ranked or complete list of what matters most.
Areas with many never-married adults vote Democratic. About 54% of adults in Harrison have never been married, modestly above similar-sized neighborhoods (around 40%).
Preventive-care access and voter turnout
Places with limited routine preventive-care access tend to turn out at a lower rate; Harrison, Minneapolis, MN sits in the bottom quarter nationally on this measure. Dental visits do not drive turnout; the rate reflects income, insurance, and healthcare access, which line up with who votes.
Why turnout in Harrison looks the way it does
Areas with high food insecurity turn out at lower rates. About 32% of adults in Harrison report food insecurity, about 16 points above the U.S. average of 16%. Limited routine healthcare access lines up with lower turnout, and Harrison sits in the bottom quarter on routine-care measures. Renters vote less often than owners, and about 74% of households in Harrison rent, about 49 points above the U.S. average of 25%. Learn more about the findings and methodology on the political spectrum map.
Nearby Neighborhoods
- Near North, Minneapolis, MN D+70
- Willard-Hay, Minneapolis, MN D+72
- Lowry Hill, Minneapolis, MN D+74
- North Loop, Minneapolis, MN D+65
- Loring Park, Minneapolis, MN D+69
- Downtown West, Minneapolis, MN D+61
- Stevens Square, Minneapolis, MN D+71
- East Isles, Minneapolis, MN D+81
- Jordan, Minneapolis, MN D+63
- Hawthorne, Minneapolis, MN D+62
Neighborhoods with Similar Populations
- Rio Grande Park, Orlando, FL D+49
- Westinghouse, Charlotte, NC D+51
- Seneca, Buffalo, NY D+6
- Indian River Park, Mims, FL R+54
- Nelson, Muskegon, MI D+42
- Downtown Trenton, Trenton, NJ D+76
- University Pines, Lubbock, TX R+27
- Galeville, Liverpool, NY D+16
- Bryan Downtown Historic District, Bryan, OH R+30
- Windsor Village, Santa Ana, CA D+19
Sources and methodology
Precinct-level voting records used to fit the model come from Minnesota Secretary of State, Elections, distributed by the Voting and Election Science Team. Demographic inputs come from the U.S. Census Bureau (ACS 5-year estimates and the 2020 Decennial Census). Health and environmental inputs come from the CDC (PLACES and the Environmental Justice Index). Land cover comes from the USGS and EPA. Election-day and lead-up weather come from PRISM 4km daily grids and the NOAA Global Historical Climatology Network. Mail-voting and election-administration patterns come from the MIT Election Lab's Survey of the Performance of American Elections. Block-group crime detail comes from CrimeGrade. Internet data and modeling support provided by ISPreports.org.
Modeling and analysis by the BestNeighborhood data science team. Full methodology and findings: political spectrum map.
Methodology reviewed by the BestNeighborhood data team. Last updated May 2026.