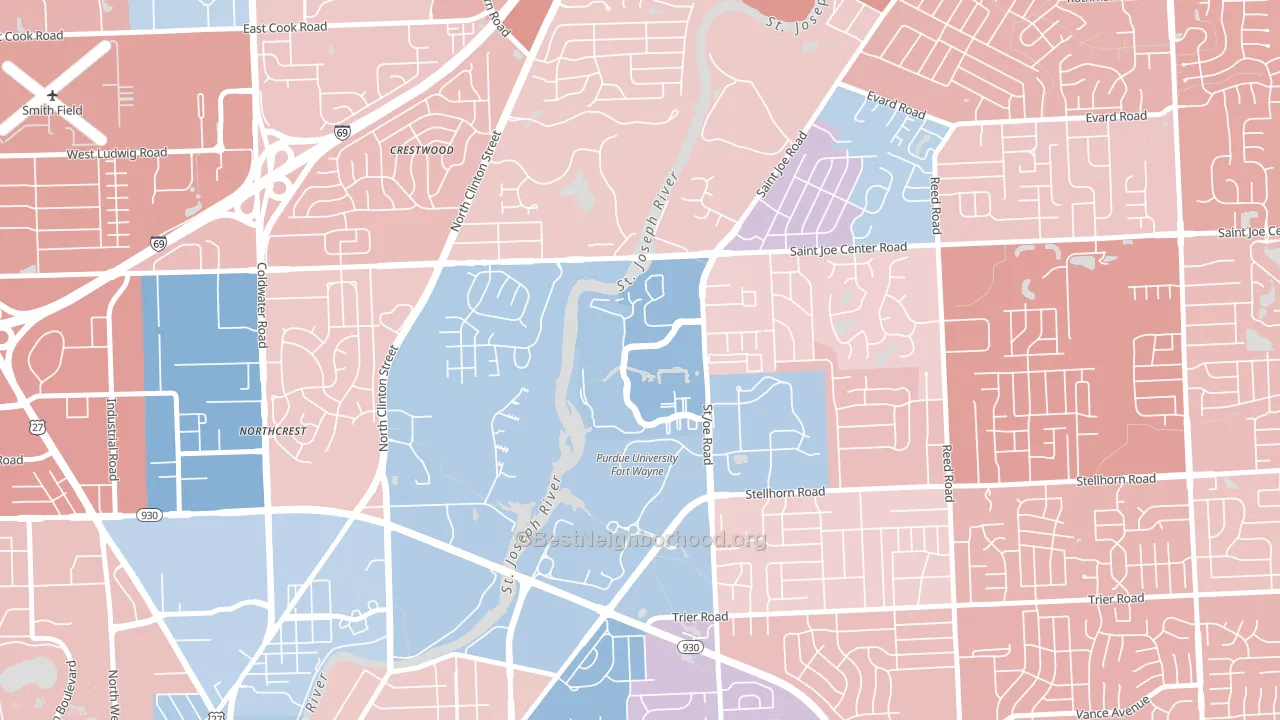
Canterbury Green leans Democratic by roughly 22 points: about 61% of voters vote Democratic and 39% Republican.
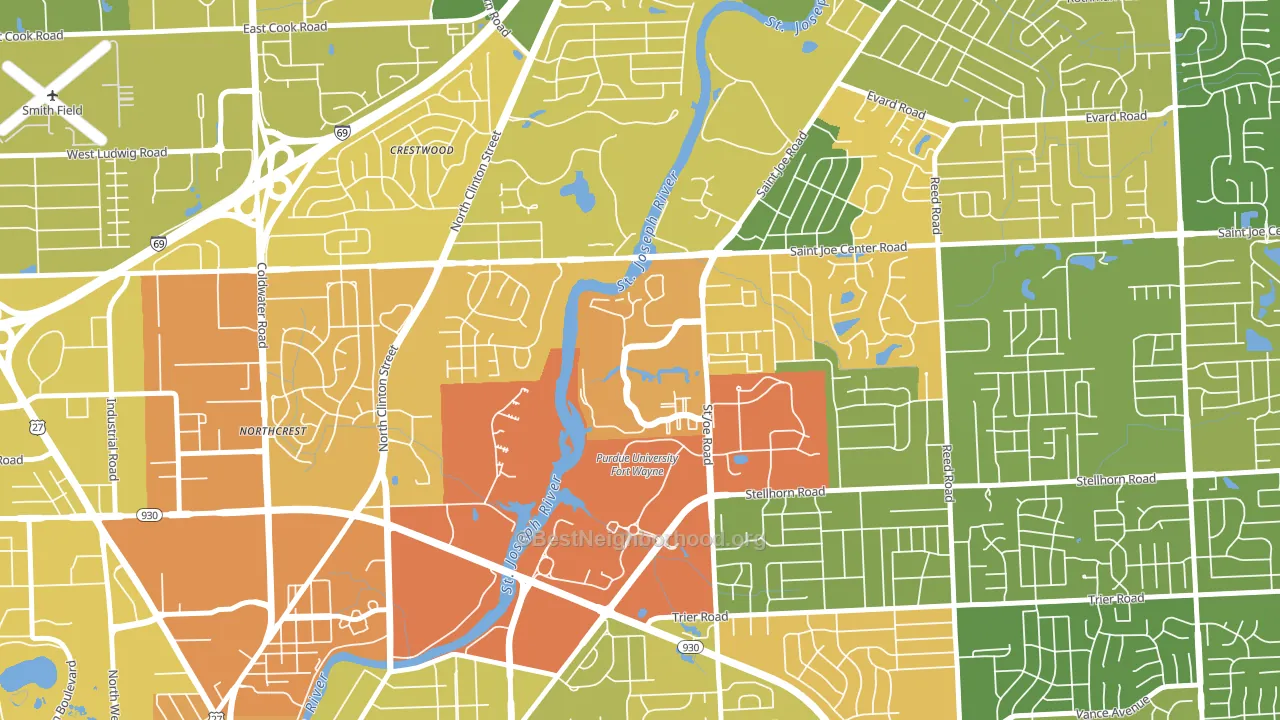
About 31% of adults in Canterbury Green typically vote, below the U.S. average of about 62%. Among adults in Canterbury Green, ~19% vote Democratic, ~12% Republican, and ~69% don't vote. The map below shows estimated turnout by block group.
How Canterbury Green compares
Among neighborhoods within 5 miles, Canterbury Green leans more Democratic than 3 of 4 neighbors.
Canterbury Green runs about 40 points more Democratic than Indiana as a whole. Indiana leans Republican overall, while Canterbury Green is one of the few Democratic-leaning pockets.
Why Canterbury Green leans the way it does
This analysis examined 14,881 data points per neighborhood to find what predicts political lean and turnout. The items below are a few correlations that stood out for Canterbury Green, not a ranked or complete list of what matters most.
Canterbury Green votes against the grain of Indiana. Indiana leans Republican overall, while Canterbury Green runs about 40 points more Democratic. A high never-married share predicts Democratic voting, and about 57% of adults in Canterbury Green have never been married, above 91% of neighborhoods.
Renting and voter turnout
Places with renter-heavy households tend to turn out at a lower rate; Canterbury Green, Fort Wayne, IN sits in the top tenth nationally on this measure.
Why turnout in Canterbury Green looks the way it does
Renters vote less often than owners. More than 99% of households in Canterbury Green rent, about 75 points above the U.S. average of 25%. Crowded housing lines up with lower turnout, and about 7% of homes in Canterbury Green have more than one occupant per room, above 84% of neighborhoods. Learn more about the findings and methodology on the political spectrum map.
Nearby Neighborhoods
- Northside, Fort Wayne, IN D+17
- Bloomingdale, Fort Wayne, IN D+3
- Arlington Park, Fort Wayne, IN R+19
- West Central, Fort Wayne, IN D+31
- Oxford, Fort Wayne, IN D+67
- Pettit-Rudisill, Fort Wayne, IN D+61
- Bryan Downtown Historic District, Bryan, OH R+30
- Holgate Avenue Historic District, Defiance, OH R+28
- Celina Main Street Historic District, Celina, OH R+48
- River Park, South Bend, IN D+21
Neighborhoods with Similar Populations
- Melrose-Rugby, Roanoke, VA D+81
- Confederate Point, Jacksonville, FL D+20
- East Meyer, Kansas City, MO D+80
- Wasatch Hollow, Salt Lake City, UT D+67
- Las Palmas, San Antonio, TX D+35
- Plymouth-Exchange, Rochester, NY D+75
- Sun Willows, Pasco, WA D+13
- Downtown Sacramento, Sacramento, CA D+46
- Boca Teeca, Boca Raton, FL Even
- Eastside, Binghamton, NY D+15
Sources and methodology
Precinct-level voting records used to fit the model come from Indiana Secretary of State, Elections, distributed by the Voting and Election Science Team. Demographic inputs come from the U.S. Census Bureau (ACS 5-year estimates and the 2020 Decennial Census). Health and environmental inputs come from the CDC (PLACES and the Environmental Justice Index). Land cover comes from the USGS and EPA. Election-day and lead-up weather come from PRISM 4km daily grids and the NOAA Global Historical Climatology Network. Mail-voting and election-administration patterns come from the MIT Election Lab's Survey of the Performance of American Elections. Block-group crime detail comes from CrimeGrade. Internet data and modeling support provided by ISPreports.org.
Modeling and analysis by the BestNeighborhood data science team. Full methodology and findings: political spectrum map.
Methodology reviewed by the BestNeighborhood data team. Last updated May 2026.