Butts Station leans heavily Republican by roughly 34 points: about 33% of voters vote Democratic and 67% Republican.
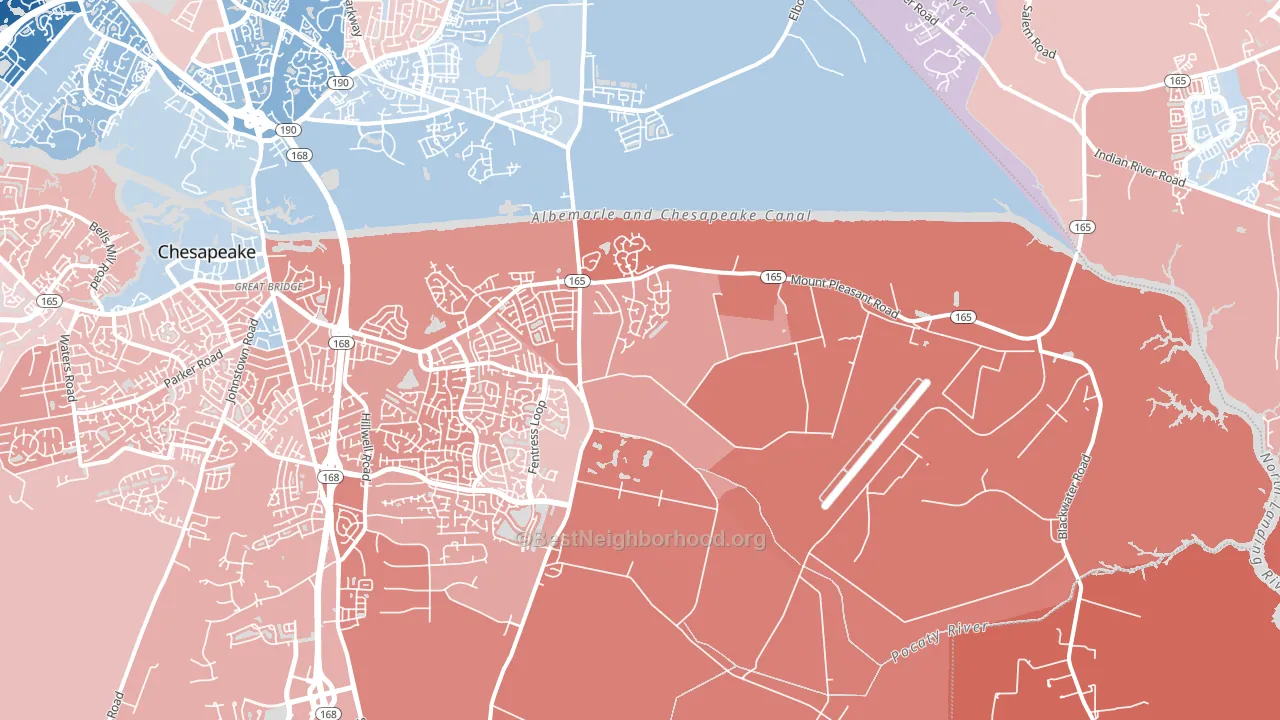
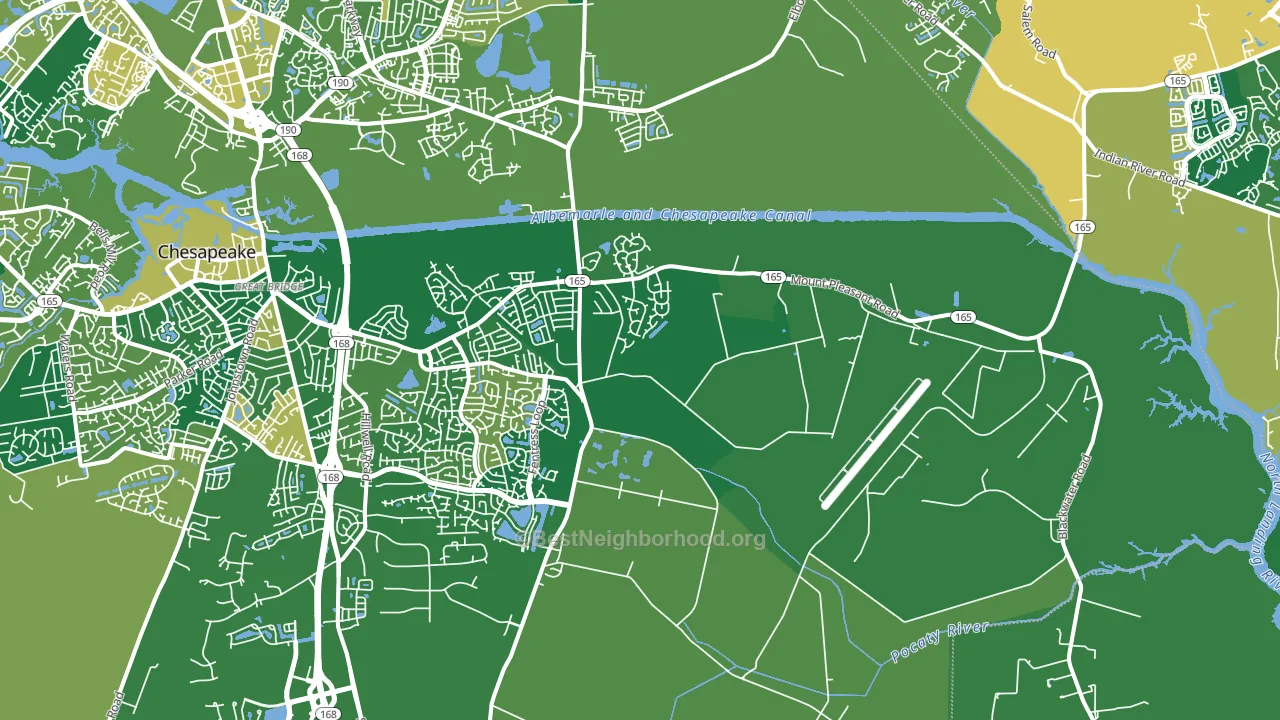
About more than 99% of adults in Butts Station typically vote, above the U.S. average of about 62%. Among adults in Butts Station, ~33% vote Democratic, ~67% Republican, and ~0% don't vote. The map below shows estimated turnout by block group.
How Butts Station compares
Among neighborhoods within 5 miles, Butts Station is the most Republican-leaning.
Butts Station runs about 40 points more Republican than Virginia as a whole. Virginia leans Democratic overall, while Butts Station is one of the few Republican-leaning pockets.
Politics vary noticeably by block within Butts Station. The southeast side is the most Republican-leaning (R+41) and the northwest side is the least Republican-leaning (R+30), a spread of about 11 points.
Why Butts Station leans the way it does
This analysis examined 14,881 data points per neighborhood to find what predicts political lean and turnout. The items below are a few correlations that stood out for Butts Station, not a ranked or complete list of what matters most.
Rural areas with a high white share vote Republican. Butts Station sits in the bottom quarter on density and about 85% of residents are non-Hispanic white, about 12 points above the Virginia average of 73%. A high family-household share predicts Republican voting, and about 85% of households in Butts Station are family households, above 92% of neighborhoods. Butts Station runs against the grain of Virginia, a Republican-leaning pocket in a Democratic-leaning state.
Walkability and Republican lean
Places with a low walkability score tend to lean Republican; Butts Station, Chesapeake, VA sits in the bottom tenth nationally on this measure. A walkable street grid does not change how people vote; it mostly reflects how urban a place is.
Why turnout in Butts Station looks the way it does
Areas with strong routine healthcare access turn out at higher rates. Butts Station is in the top quarter nationally for routine-care measures such as insurance coverage, preventive screenings, and dental visits. The dental-visit rate here is about 76%, about 16 points above the U.S. average of 60%. Homeowners vote more often than renters, and about 93% of households in Butts Station own their home, compared to around 78% in nearby neighborhoods. Learn more about the findings and methodology on the political spectrum map.
Nearby Neighborhoods
- Great Bridge East, Chesapeake, VA R+26
- Greenbrier East, Chesapeake, VA D+8
- Great Bridge, Chesapeake, VA R+11
- Greenbrier West, Chesapeake, VA D+25
- Pleasant Grove East, Chesapeake, VA R+34
- Pleasant Grove West, Chesapeake, VA R+31
- Indian River, Chesapeake, VA D+34
- South Norfolk, Chesapeake, VA D+38
- Kempsville Gardens, Virginia Beach, VA D+20
- Deep Creek South, Chesapeake, VA D+4
Neighborhoods with Similar Populations
- University of Ohio Akron, Akron, OH D+49
- Brighton, Syracuse, NY D+78
- Downtown Norfolk, Norfolk, VA D+61
- West End Theatre District, Allentown, PA D+26
- Roosevelt Park, Grand Rapids, MI D+39
- Veterans Park, Boise, ID D+29
- Magnolia Place, Fresno, TX D+44
- El Rio, Oxnard, CA D+34
- North Dakota State University, Fargo, ND D+7
- Wildhorse, San Antonio, TX D+2
Sources and methodology
Precinct-level voting records used to fit the model come from Virginia Department of Elections, distributed by the Voting and Election Science Team. Demographic inputs come from the U.S. Census Bureau (ACS 5-year estimates and the 2020 Decennial Census). Health and environmental inputs come from the CDC (PLACES and the Environmental Justice Index). Land cover comes from the USGS and EPA. Election-day and lead-up weather come from PRISM 4km daily grids and the NOAA Global Historical Climatology Network. Mail-voting and election-administration patterns come from the MIT Election Lab's Survey of the Performance of American Elections. Block-group crime detail comes from CrimeGrade. Internet data and modeling support provided by ISPreports.org.
Modeling and analysis by the BestNeighborhood data science team. Full methodology and findings: political spectrum map.
Methodology reviewed by the BestNeighborhood data team. Last updated May 2026.