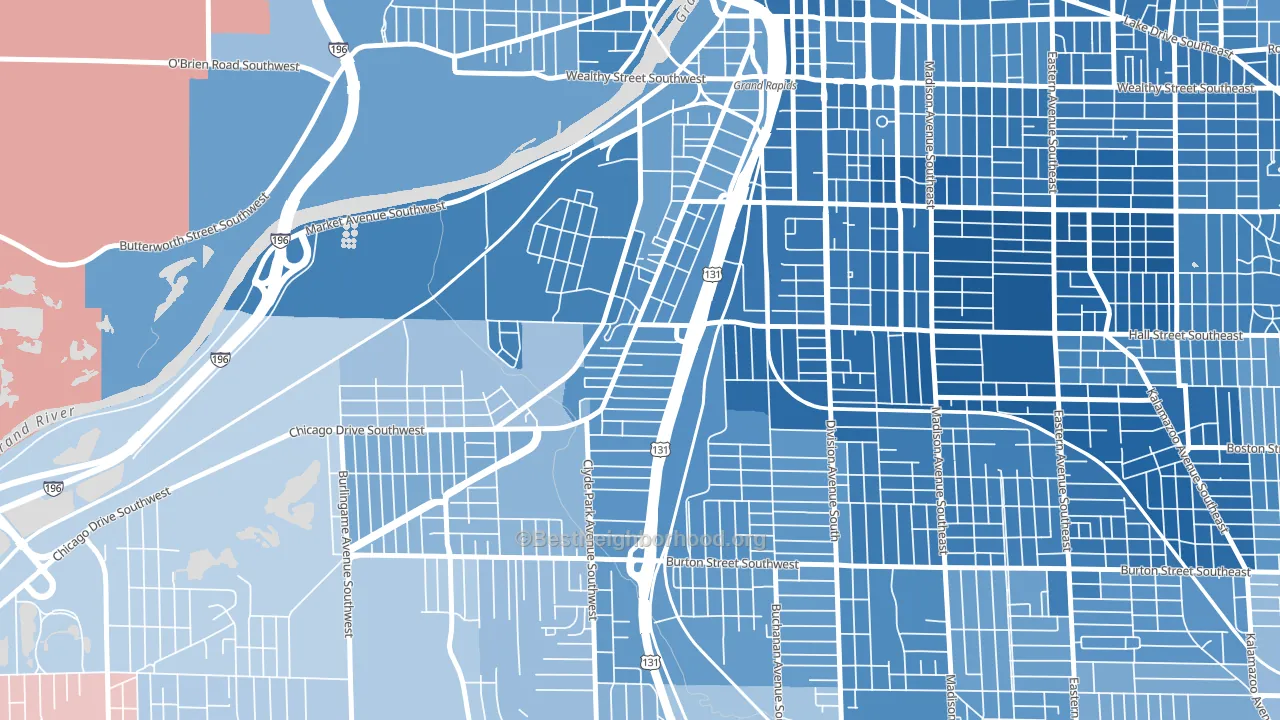
Roosevelt Park leans heavily Democratic by roughly 40 points: about 70% of voters vote Democratic and 30% Republican.
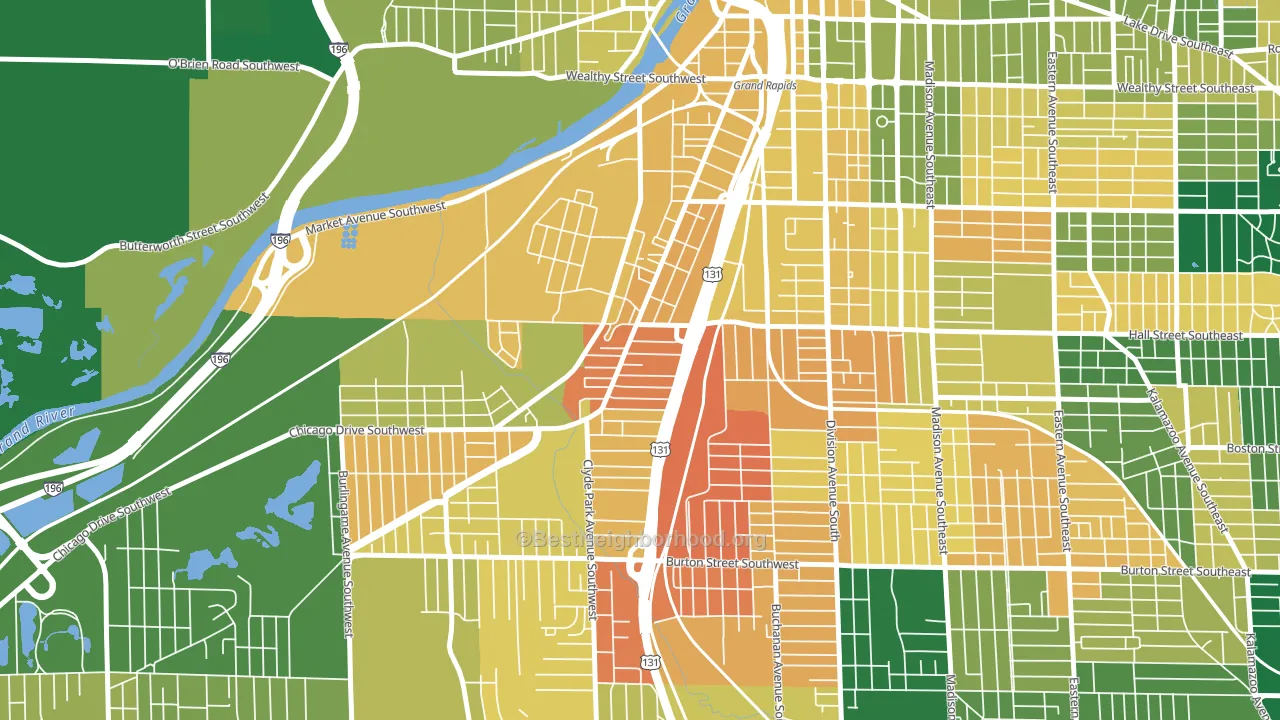
About 37% of adults in Roosevelt Park typically vote, below the U.S. average of about 62%. Among adults in Roosevelt Park, ~26% vote Democratic, ~11% Republican, and ~63% don't vote. The map below shows estimated turnout by block group.
How Roosevelt Park compares
Among neighborhoods within 5 miles, Roosevelt Park leans more Democratic than 7 of 20 neighbors.
Roosevelt Park runs about 41 points more Democratic than Michigan as a whole. Michigan is roughly evenly split, and Roosevelt Park sits clearly on the Democratic side.
Why Roosevelt Park leans the way it does
This analysis examined 14,881 data points per neighborhood to find what predicts political lean and turnout. The items below are a few correlations that stood out for Roosevelt Park, not a ranked or complete list of what matters most.
Roosevelt Park votes against the grain of Michigan. Michigan is roughly evenly split, while Roosevelt Park runs about 41 points more Democratic. A high never-married share predicts Democratic voting, and about 55% of adults in Roosevelt Park have never been married, above 88% of neighborhoods.
Paved land cover and Democratic lean
Places with extensive paved surfaces tend to lean Democratic; Roosevelt Park, Grand Rapids, MI sits in the top tenth nationally on this measure. Paved ground does not change how people vote; it mostly reflects how urban and built-up a place is.
Why turnout in Roosevelt Park looks the way it does
Areas with limited routine healthcare access turn out at lower rates. Roosevelt Park is in the bottom quarter nationally for routine-care measures such as insurance coverage, preventive screenings, and dental visits. The dental-visit rate here is about 46%, about 21 points below the Michigan average of 67%. Renters vote less often than owners, and about 65% of households in Roosevelt Park rent, about 40 points above the U.S. average of 25%. High food insecurity lines up with lower turnout, and about 40% of adults in Roosevelt Park report food insecurity, above 93% of neighborhoods. Learn more about the findings and methodology on the political spectrum map.
Nearby Neighborhoods
- South East Community, Grand Rapids, MI D+66
- Garfield Park, Grand Rapids, MI D+48
- Madison Area, Grand Rapids, MI D+72
- Heartside-Downtown, Grand Rapids, MI D+55
- Swan, Grand Rapids, MI D+45
- Heritage Hill, Grand Rapids, MI D+61
- John Ball Park, Grand Rapids, MI D+31
- Fuller Avenue, Grand Rapids, MI D+71
- East Hills, Grand Rapids, MI D+58
- South East End, Grand Rapids, MI D+54
Neighborhoods with Similar Populations
- Veterans Park, Boise, ID D+29
- El Rio, Oxnard, CA D+34
- Magnolia Place, Fresno, TX D+44
- Butts Station, Chesapeake, VA R+34
- University of Ohio Akron, Akron, OH D+49
- Downtown Norfolk, Norfolk, VA D+61
- Brighton, Syracuse, NY D+78
- West End Theatre District, Allentown, PA D+26
- North Dakota State University, Fargo, ND D+7
- North Orange, Orlando, FL D+15
Sources and methodology
Precinct-level voting records used to fit the model come from Michigan Department of State, Elections, distributed by the Voting and Election Science Team. Demographic inputs come from the U.S. Census Bureau (ACS 5-year estimates and the 2020 Decennial Census). Health and environmental inputs come from the CDC (PLACES and the Environmental Justice Index). Land cover comes from the USGS and EPA. Election-day and lead-up weather come from PRISM 4km daily grids and the NOAA Global Historical Climatology Network. Mail-voting and election-administration patterns come from the MIT Election Lab's Survey of the Performance of American Elections. Block-group crime detail comes from CrimeGrade. Internet data and modeling support provided by ISPreports.org.
Modeling and analysis by the BestNeighborhood data science team. Full methodology and findings: political spectrum map.
Methodology reviewed by the BestNeighborhood data team. Last updated May 2026.