Veterans Park leans Democratic by roughly 30 points: about 65% of voters vote Democratic and 35% Republican.
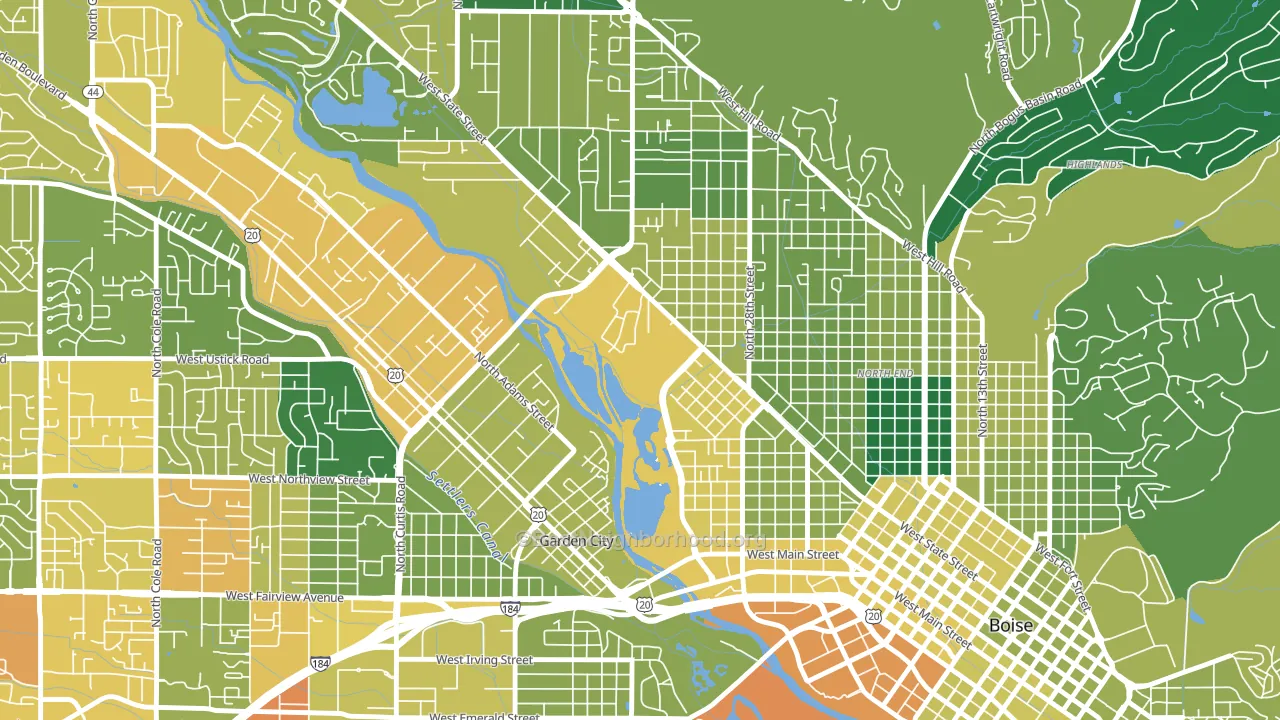
About 61% of adults in Veterans Park typically vote, near the U.S. average of about 62%. Among adults in Veterans Park, ~40% vote Democratic, ~21% Republican, and ~39% don't vote. The map below shows estimated turnout by block group.
How Veterans Park compares
Among neighborhoods within 5 miles, Veterans Park leans more Democratic than 10 of 15 neighbors.
Veterans Park runs about 65 points more Democratic than Idaho as a whole. Idaho leans Republican overall, while Veterans Park is one of the few Democratic-leaning pockets.
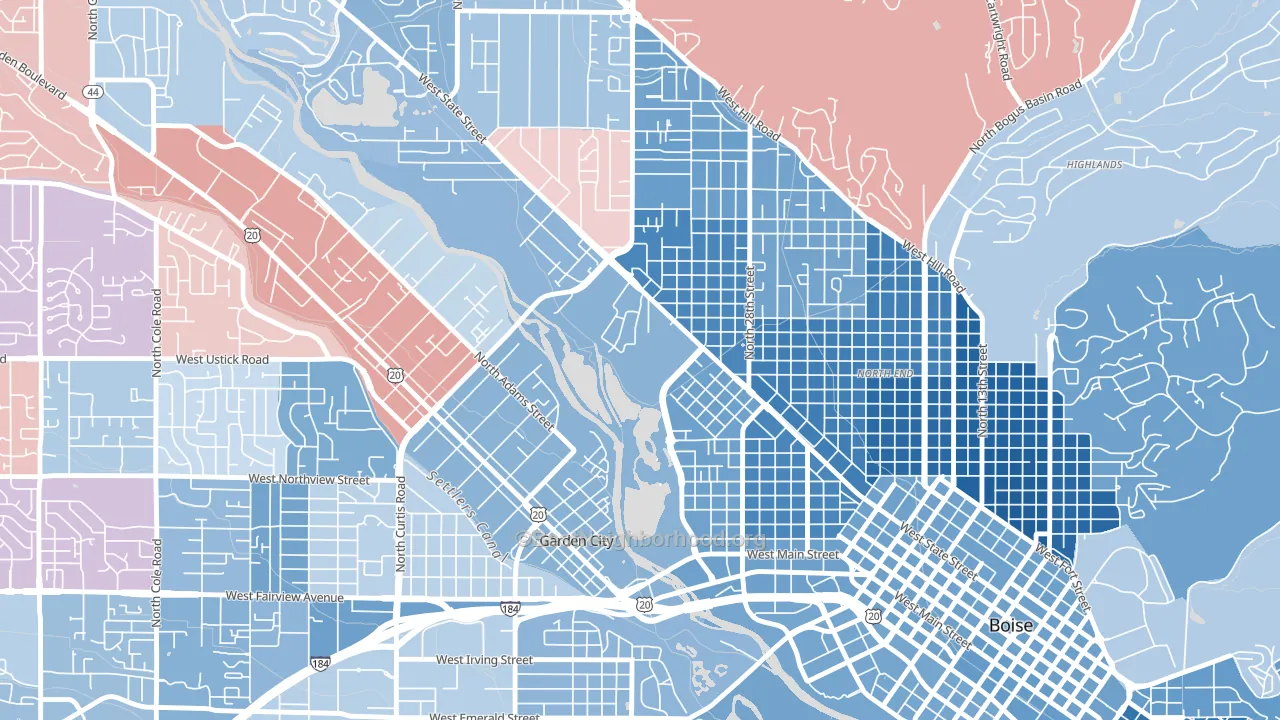
Politics vary noticeably by block within Veterans Park. The southeast side is the most Democratic-leaning (D+46) and the northwest side is the least Democratic-leaning (D+14), a spread of about 32 points.
Why Veterans Park leans the way it does
This analysis examined 14,881 data points per neighborhood to find what predicts political lean and turnout. The items below are a few correlations that stood out for Veterans Park, not a ranked or complete list of what matters most.
Veterans Park votes against the grain of Idaho. Idaho leans Republican overall, while Veterans Park runs about 65 points more Democratic.
Paved land cover and Democratic lean
Places with extensive paved surfaces tend to lean Democratic; Veterans Park, Boise, ID sits above the national average on this measure. Paved ground does not change how people vote; it mostly reflects how urban and built-up a place is.
Why turnout in Veterans Park looks the way it does
High-crime urban areas turn out at lower rates, mostly because the housing stress common in those areas makes voting harder. Veterans Park sits in the top 15% nationally on a violent-crime measure. See CrimeGrade for more details. Learn more about the findings and methodology on the political spectrum map.
Nearby Neighborhoods
- Sunset, Boise, ID D+44
- North End, Boise, ID D+57
- Winstead Park, Boise, ID D+20
- Downtown, Boise, ID D+37
- Collister, Boise, ID D+21
- Highlands, Boise, ID D+20
- Depot Bench, Boise, ID D+35
- West Bench, Boise, ID D+4
- Central Bench, Boise, ID D+21
- Franklin Randolph, Boise, ID Even
Neighborhoods with Similar Populations
- El Rio, Oxnard, CA D+34
- Magnolia Place, Fresno, TX D+44
- Roosevelt Park, Grand Rapids, MI D+39
- Butts Station, Chesapeake, VA R+34
- University of Ohio Akron, Akron, OH D+49
- Brighton, Syracuse, NY D+78
- Downtown Norfolk, Norfolk, VA D+61
- West End Theatre District, Allentown, PA D+26
- North Dakota State University, Fargo, ND D+7
- North Orange, Orlando, FL D+15
Sources and methodology
Precinct-level voting records used to fit the model come from Idaho Secretary of State, Elections, distributed by the Voting and Election Science Team. Demographic inputs come from the U.S. Census Bureau (ACS 5-year estimates and the 2020 Decennial Census). Health and environmental inputs come from the CDC (PLACES and the Environmental Justice Index). Land cover comes from the USGS and EPA. Election-day and lead-up weather come from PRISM 4km daily grids and the NOAA Global Historical Climatology Network. Mail-voting and election-administration patterns come from the MIT Election Lab's Survey of the Performance of American Elections. Block-group crime detail comes from CrimeGrade. Internet data and modeling support provided by ISPreports.org.
Modeling and analysis by the BestNeighborhood data science team. Full methodology and findings: political spectrum map.
Methodology reviewed by the BestNeighborhood data team. Last updated May 2026.