Deep Creek South is a true toss-up. About 52% of voters here vote Democratic and 48% Republican.
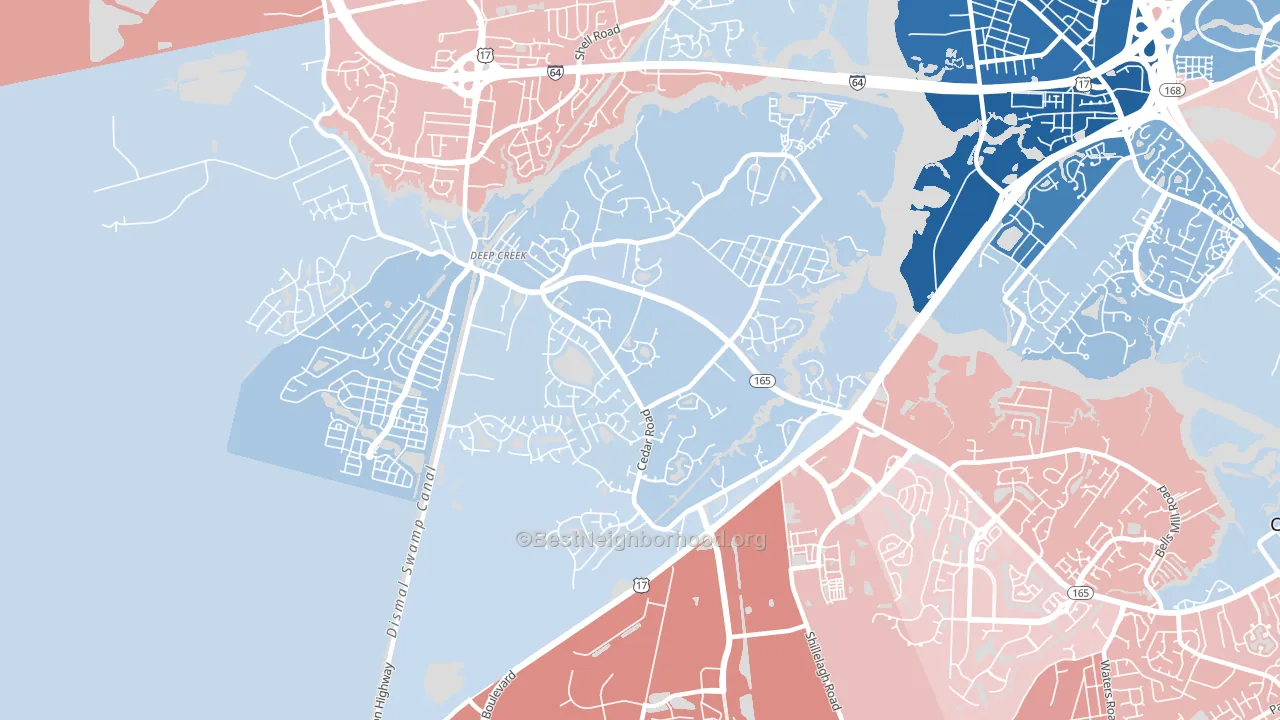
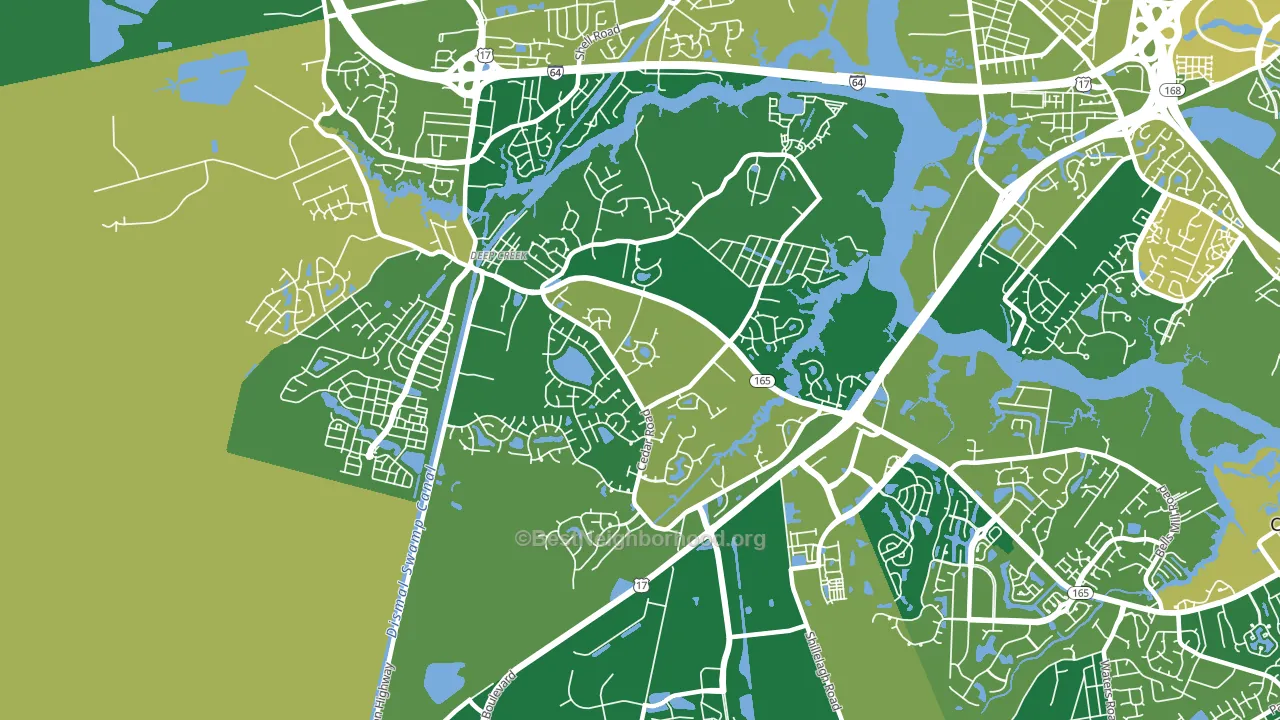
About 91% of adults in Deep Creek South typically vote, above the U.S. average of about 62%. Among adults in Deep Creek South, ~47% vote Democratic, ~44% Republican, and ~9% don't vote. The map below shows estimated turnout by block group.
How Deep Creek South compares
Among neighborhoods within 5 miles, Deep Creek South leans more Democratic than 1 of 4 neighbors.
Politically, Deep Creek South sits close to the rest of Virginia.
Politics vary noticeably by block within Deep Creek South. The north side runs the most Democratic (D+14) and the southwest side runs the most Republican (Even), a spread of about 16 points.
Why Deep Creek South leans the way it does
Density, race composition, education, and family structure all sit close to their national averages in Deep Creek South. The lean here lands roughly where demographic data alone would predict.
High-school completion, developed land, and voter turnout
Places that combine high-school-completion-heavy adults and a rural land-use pattern tend to turn out at a higher rate, as Deep Creek South, Chesapeake, VA does.
Why turnout in Deep Creek South looks the way it does
Areas with strong routine healthcare access turn out at higher rates. Deep Creek South is in the top quarter nationally for routine-care measures such as insurance coverage, preventive screenings, and dental visits. The dental-visit rate here is about 72%, about 12 points above the U.S. average of 60%. Homeowners vote more often than renters, and about 91% of households in Deep Creek South own their home, about 16 points above the U.S. average of 75%. Learn more about the findings and methodology on the political spectrum map.
Nearby Neighborhoods
- Deep Creek West, Chesapeake, VA D+5
- Deep Creek North, Chesapeake, VA D+18
- Great Bridge, Chesapeake, VA R+11
- Greenbrier West, Chesapeake, VA D+25
- South Norfolk, Chesapeake, VA D+38
- Pleasant Grove West, Chesapeake, VA R+31
- Western Branch South, Chesapeake, VA D+18
- Greenbrier East, Chesapeake, VA D+8
- Indian River, Chesapeake, VA D+34
- Great Bridge East, Chesapeake, VA R+26
Neighborhoods with Similar Populations
- Jackson Park, Milwaukee, WI D+24
- Welleby, Sunrise, FL D+21
- Huffman-O'Malley, Anchorage, AK D+18
- New City, Chicago, IL D+54
- Near East, Dallas, TX D+24
- Edison Historic District, Pomona, CA D+36
- Schiller Park, Buffalo, NY D+72
- Greater Fifth Ward, Houston, TX D+63
- Fells Point, Baltimore, MD D+70
- Southgate, Portland, OR D+20
Sources and methodology
Precinct-level voting records used to fit the model come from Virginia Department of Elections, distributed by the Voting and Election Science Team. Demographic inputs come from the U.S. Census Bureau (ACS 5-year estimates and the 2020 Decennial Census). Health and environmental inputs come from the CDC (PLACES and the Environmental Justice Index). Land cover comes from the USGS and EPA. Election-day and lead-up weather come from PRISM 4km daily grids and the NOAA Global Historical Climatology Network. Mail-voting and election-administration patterns come from the MIT Election Lab's Survey of the Performance of American Elections. Block-group crime detail comes from CrimeGrade. Internet data and modeling support provided by ISPreports.org.
Modeling and analysis by the BestNeighborhood data science team. Full methodology and findings: political spectrum map.
Methodology reviewed by the BestNeighborhood data team. Last updated May 2026.