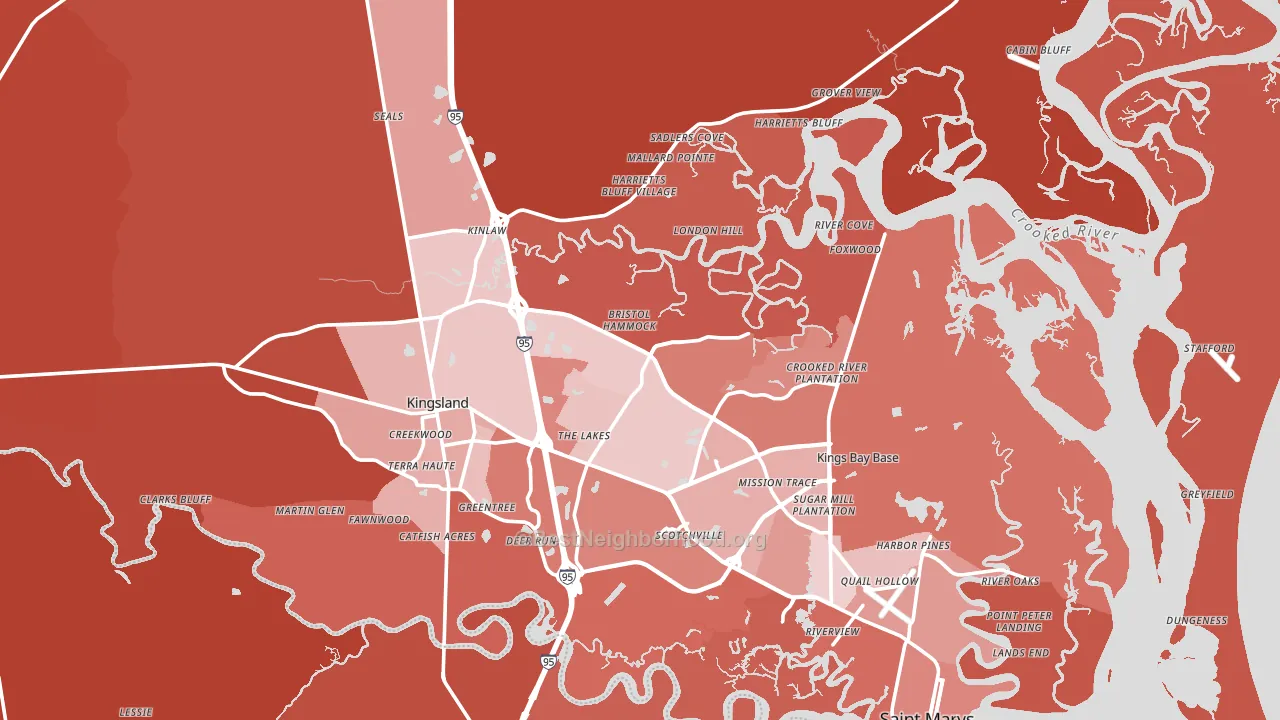
Camden County leans heavily Republican by roughly 34 points: about 33% of voters vote Democratic and 67% Republican.
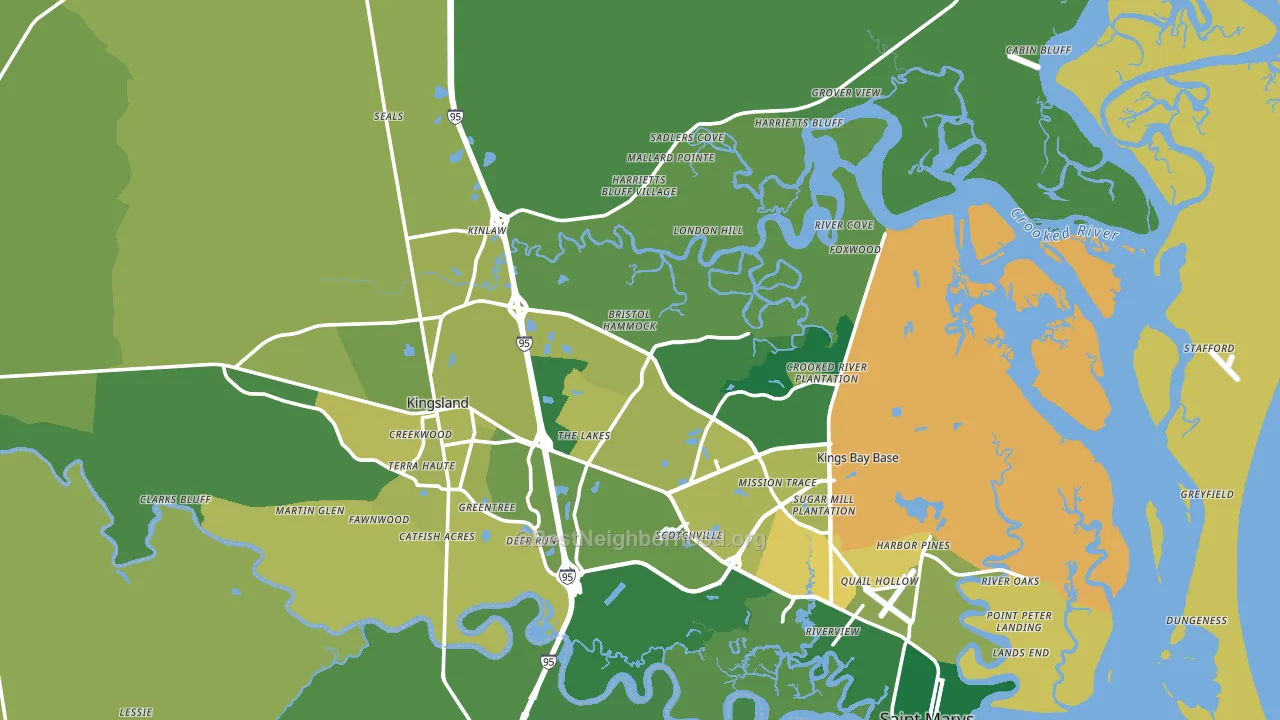
About 73% of adults in Camden County typically vote, above the U.S. average of about 62%. Among adults in Camden County, ~24% vote Democratic, ~49% Republican, and ~27% don't vote. The map below shows estimated turnout by block group.
How Camden County compares
Among counties within 50 miles, Camden County leans more Republican than 3 of 7 neighbors.
Camden County runs about 32 points more Republican than Georgia as a whole.
Politics vary noticeably by city within Camden County. The northeast side is the most Republican-leaning (R+62) and the south side is the least Republican-leaning (R+32), a spread of about 30 points.
Why Camden County leans the way it does
This analysis examined 14,881 data points per county to find what predicts political lean and turnout. The items below are a few correlations that stood out for Camden County, not a ranked or complete list of what matters most.
Areas with many family households vote Republican. About 71% of households in Camden County are family households, above 85% of counties.
Population density and Democratic lean
Places with high population density tend to lean Democratic; Camden County, GA sits above the national average on this measure.
Why turnout in Camden County looks the way it does
Areas with high high-school completion turn out at higher rates. About 94% of adults in Camden County have completed high school, about 7 points above the Georgia average of 86%. Learn more about the findings and methodology on the political spectrum map.
Nearby Counties
- Nassau County, FL R+47
- Charlton County, GA R+46
- Glynn County, GA R+14
- Brantley County, GA R+80
- Duval County, FL D+7
- McIntosh County, GA R+24
- Baker County, FL R+61
- Pierce County, GA R+71
- Clay County, FL R+31
- Ware County, GA R+30
Counties with Similar Populations
- Grady County, OK R+58
- Jefferson County, TN R+61
- Loudon County, TN R+53
- Franklin County, VA R+46
- Seneca County, OH R+35
- Lenoir County, NC Even
- Dickson County, TN R+55
- Saline County, KS R+26
- Watauga County, NC D+6
- Hancock County, ME D+5
Sources and methodology
Precinct-level voting records used to fit the model come from Georgia Elections Division, distributed by the Voting and Election Science Team. Demographic inputs come from the U.S. Census Bureau (ACS 5-year estimates and the 2020 Decennial Census). Health and environmental inputs come from the CDC (PLACES and the Environmental Justice Index). Land cover comes from the USGS and EPA. Election-day and lead-up weather come from PRISM 4km daily grids and the NOAA Global Historical Climatology Network. Mail-voting and election-administration patterns come from the MIT Election Lab's Survey of the Performance of American Elections. Block-group crime detail comes from CrimeGrade. Internet data and modeling support provided by ISPreports.org.
Modeling and analysis by the BestNeighborhood data science team. Full methodology and findings: political spectrum map.
Methodology reviewed by the BestNeighborhood data team. Last updated May 2026.