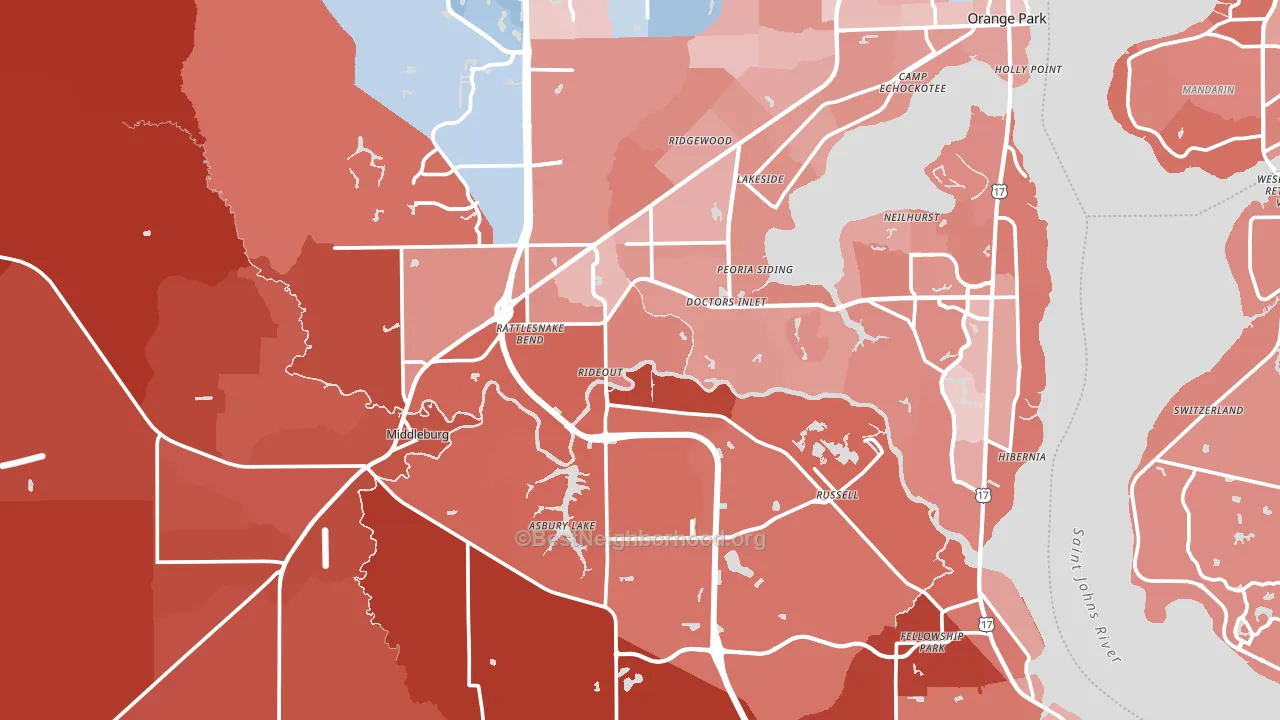
Clay County leans heavily Republican by roughly 32 points: about 34% of voters vote Democratic and 66% Republican.
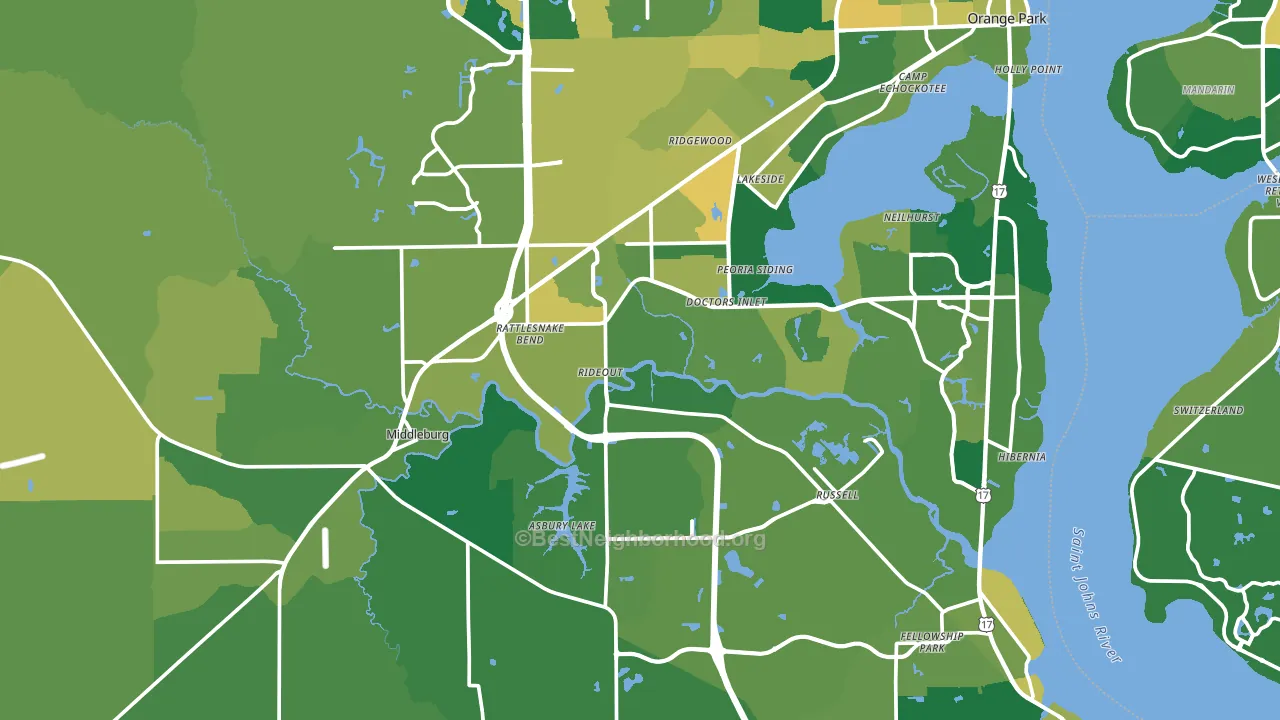
About 79% of adults in Clay County typically vote, above the U.S. average of about 62%. Among adults in Clay County, ~27% vote Democratic, ~52% Republican, and ~21% don't vote. The map below shows estimated turnout by block group.
How Clay County compares
Among counties within 50 miles, Clay County leans more Republican than 3 of 8 neighbors.
Clay County runs about 18 points more Republican than Florida as a whole.
Politics vary noticeably by city within Clay County. The northwest side is the most Republican-leaning (R+68) and the north side is the least Republican-leaning (R+11), a spread of about 57 points.
Why Clay County leans the way it does
This analysis examined 14,881 data points per county to find what predicts political lean and turnout. The items below are a few correlations that stood out for Clay County, not a ranked or complete list of what matters most.
Clay County votes Republican even though it is densely developed (about 56%, about 20 points above the U.S. average of 36%). State and regional patterns outweigh the Democratic lean that density usually predicts here. A high family-household share predicts Republican voting, and about 74% of households in Clay County are family households, above 94% of counties.
Paved land cover and Democratic lean
Places with extensive paved surfaces tend to lean Democratic; Clay County, FL sits in the top quarter nationally on this measure. Paved ground does not change how people vote; it mostly reflects how urban and built-up a place is.
Why turnout in Clay County looks the way it does
Turnout in Clay County sits close to the national pattern. Routine healthcare access, homeownership, education, and food security all land near their national averages here. Learn more about the findings and methodology on the political spectrum map.
Nearby Counties
- Duval County, FL D+7
- Bradford County, FL R+50
- St. Johns County, FL R+26
- Baker County, FL R+61
- Putnam County, FL R+42
- Union County, FL R+61
- Nassau County, FL R+47
- Alachua County, FL D+22
- Charlton County, GA R+46
- Camden County, GA R+35
Counties with Similar Populations
- Dona Ana County, NM D+4
- Calcasieu Parish, LA R+29
- Montgomery County, TN R+16
- Yolo County, CA D+35
- Johnston County, NC R+21
- Lackawanna County, PA Even
- Delaware County, OH R+5
- Shelby County, AL R+36
- Mohave County, AZ R+37
- Jackson County, OR R+3
Sources and methodology
Precinct-level voting records used to fit the model come from Florida Division of Elections, distributed by the Voting and Election Science Team. Demographic inputs come from the U.S. Census Bureau (ACS 5-year estimates and the 2020 Decennial Census). Health and environmental inputs come from the CDC (PLACES and the Environmental Justice Index). Land cover comes from the USGS and EPA. Election-day and lead-up weather come from PRISM 4km daily grids and the NOAA Global Historical Climatology Network. Mail-voting and election-administration patterns come from the MIT Election Lab's Survey of the Performance of American Elections. Block-group crime detail comes from CrimeGrade. Internet data and modeling support provided by ISPreports.org.
Modeling and analysis by the BestNeighborhood data science team. Full methodology and findings: political spectrum map.
Methodology reviewed by the BestNeighborhood data team. Last updated May 2026.