Cascade Heights is a Democratic stronghold. About 93% of voters here vote Democratic and 7% Republican.
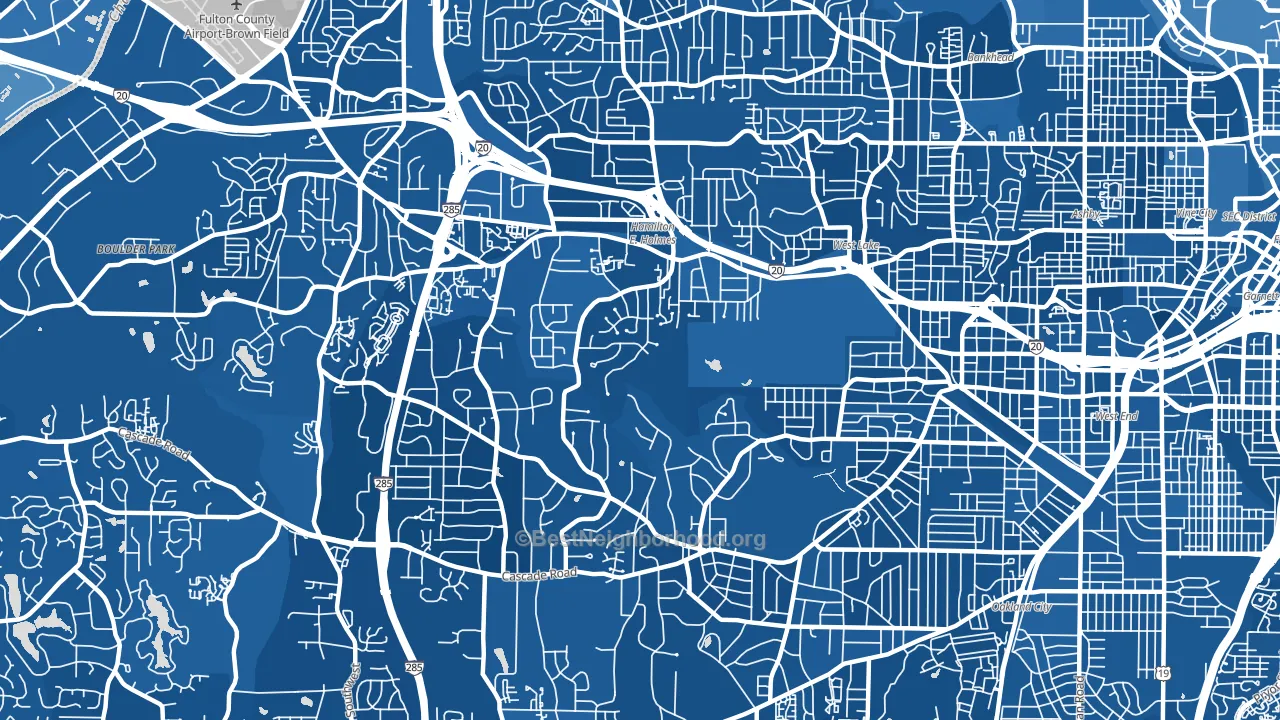
About 65% of adults in Cascade Heights typically vote, near the U.S. average of about 62%. Among adults in Cascade Heights, ~61% vote Democratic, ~4% Republican, and ~35% don't vote. The map below shows estimated turnout by block group.
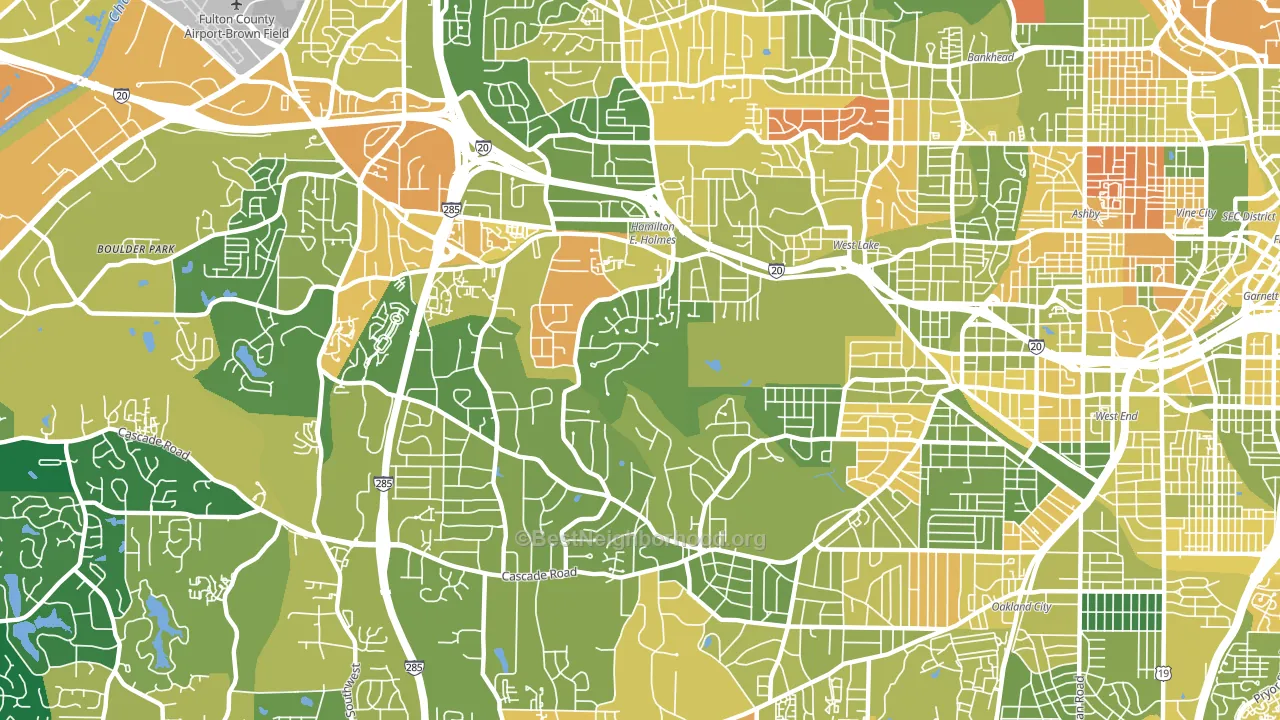
How Cascade Heights compares
Among neighborhoods within 5 miles, Cascade Heights leans more Democratic than 12 of 13 neighbors.
Cascade Heights runs about 89 points more Democratic than Georgia as a whole. Georgia is roughly evenly split, and Cascade Heights sits clearly on the Democratic side.
Why Cascade Heights leans the way it does
This analysis examined 14,881 data points per neighborhood to find what predicts political lean and turnout. The items below are a few correlations that stood out for Cascade Heights, not a ranked or complete list of what matters most.
Cascade Heights votes against the grain of Georgia. Georgia is roughly evenly split, while Cascade Heights runs about 89 points more Democratic. A high never-married share predicts Democratic voting, and about 51% of adults in Cascade Heights have never been married, above 84% of neighborhoods.
Food insecurity and voter turnout
Places with high food insecurity tend to turn out at a lower rate; Cascade Heights, Atlanta, GA sits in the top quarter nationally on this measure. Food insecurity does not directly drive turnout; it reflects economic hardship, which lines up with lower voting.
Why turnout in Cascade Heights looks the way it does
Turnout in Cascade Heights sits close to the national pattern. Learn more about the findings and methodology on the political spectrum map.
Nearby Neighborhoods
- Grove Park, Atlanta, GA D+85
- Adamsville, Atlanta, GA D+86
- Center Hill, Atlanta, GA D+87
- Adams Park, Atlanta, GA D+86
- West End, Atlanta, GA D+85
- University Center, Atlanta, GA D+88
- Oakland City, Atlanta, GA D+85
- Vine City, Atlanta, GA D+78
- Adair Park, Atlanta, GA D+83
- Mechanicsville, Atlanta, GA D+80
Neighborhoods with Similar Populations
- Southeast Yonkers, Yonkers, NY D+11
- Park Forest-Louisiana North, Baton Rouge, LA D+45
- Kaimuki, Honolulu, HI D+32
- Westside, Santa Cruz, CA D+73
- Alden Bridge, The Woodlands, TX R+24
- Cherry Creek, Denver, CO D+31
- Upper State, Santa Barbara, CA D+51
- Kenwood, Chicago, IL D+84
- Chatham, Chicago, IL D+85
- Merrlam Park, St. Paul, MN D+65
Sources and methodology
Precinct-level voting records used to fit the model come from Georgia Elections Division, distributed by the Voting and Election Science Team. Demographic inputs come from the U.S. Census Bureau (ACS 5-year estimates and the 2020 Decennial Census). Health and environmental inputs come from the CDC (PLACES and the Environmental Justice Index). Land cover comes from the USGS and EPA. Election-day and lead-up weather come from PRISM 4km daily grids and the NOAA Global Historical Climatology Network. Mail-voting and election-administration patterns come from the MIT Election Lab's Survey of the Performance of American Elections. Block-group crime detail comes from CrimeGrade. Internet data and modeling support provided by ISPreports.org.
Modeling and analysis by the BestNeighborhood data science team. Full methodology and findings: political spectrum map.
Methodology reviewed by the BestNeighborhood data team. Last updated May 2026.