West End is a Democratic stronghold. About 93% of voters here vote Democratic and 7% Republican.

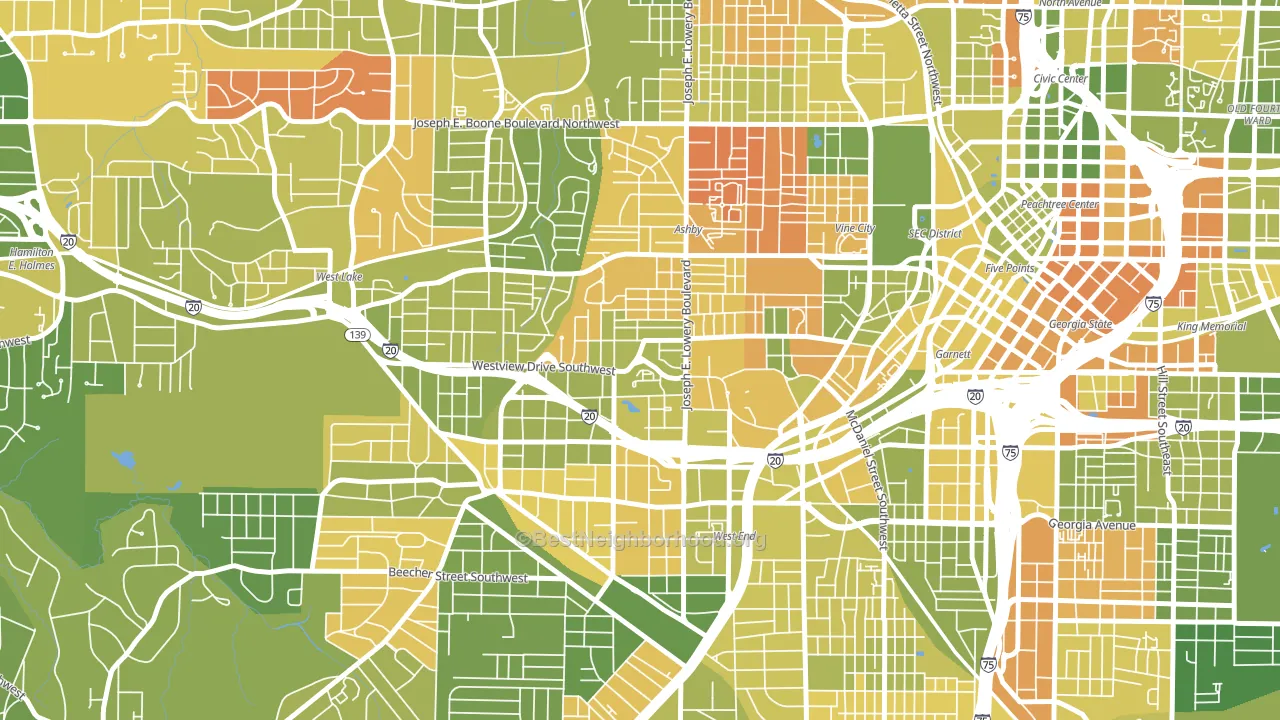
About 55% of adults in West End typically vote, below the U.S. average of about 62%. Among adults in West End, ~51% vote Democratic, ~4% Republican, and ~45% don't vote. The map below shows estimated turnout by block group.
How West End compares
Among neighborhoods within 5 miles, West End leans more Democratic than 19 of 24 neighbors.
West End runs about 87 points more Democratic than Georgia as a whole. Georgia is roughly evenly split, and West End sits clearly on the Democratic side.
Why West End leans the way it does
This analysis examined 14,881 data points per neighborhood to find what predicts political lean and turnout. The items below are a few correlations that stood out for West End, not a ranked or complete list of what matters most.
Dense areas vote Democratic. More than 99% of residents in West End live in densely developed areas, about 64 points above the U.S. average of 36%. A high never-married share predicts Democratic voting, and about 58% of adults in West End have never been married, above 91% of neighborhoods. West End runs against the grain of Georgia, a Democratic-leaning outlier in a roughly evenly split state.
Never-married share, developed land, and voter turnout
Places that combine a never-married-heavy adult population and a heavily developed built environment tend to turn out at a lower rate, as West End, Atlanta, GA does.
Why turnout in West End looks the way it does
Areas with limited routine healthcare access turn out at lower rates. West End is in the bottom quarter nationally for routine-care measures such as insurance coverage, preventive screenings, and dental visits. The dental-visit rate here is about 46%, about 10 points below the Georgia average of 56%. High food insecurity lines up with lower turnout, and about 35% of adults in West End report food insecurity, above 89% of neighborhoods. High-crime urban areas turn out at lower rates, and West End sits in the top 15% on a violent-crime measure. Learn more about the findings and methodology on the political spectrum map.
Nearby Neighborhoods
- University Center, Atlanta, GA D+88
- Vine City, Atlanta, GA D+78
- Mechanicsville, Atlanta, GA D+80
- Adair Park, Atlanta, GA D+83
- Downtown, Atlanta, GA D+60
- Five Points, Atlanta, GA D+76
- Grove Park, Atlanta, GA D+85
- Grant Park, Atlanta, GA D+71
- Sweet Auburn, Atlanta, GA D+72
- Oakland City, Atlanta, GA D+85
Neighborhoods with Similar Populations
- Downtown East, Las Vegas, NV D+36
- Windsor Hills, Austin, TX D+55
- Black Mountain Ranch, San Diego, CA D+16
- South Park Hill, Denver, CO D+74
- South Lamar, Austin, TX D+49
- Beverly, Toledo, OH D+19
- Northside, Riverside, CA D+17
- Mt Vernon Square, Washington, DC D+74
- Irvington, Portland, OR D+85
- Iowa State University, Ames, IA D+22
Sources and methodology
Precinct-level voting records used to fit the model come from Georgia Elections Division, distributed by the Voting and Election Science Team. Demographic inputs come from the U.S. Census Bureau (ACS 5-year estimates and the 2020 Decennial Census). Health and environmental inputs come from the CDC (PLACES and the Environmental Justice Index). Land cover comes from the USGS and EPA. Election-day and lead-up weather come from PRISM 4km daily grids and the NOAA Global Historical Climatology Network. Mail-voting and election-administration patterns come from the MIT Election Lab's Survey of the Performance of American Elections. Block-group crime detail comes from CrimeGrade. Internet data and modeling support provided by ISPreports.org.
Modeling and analysis by the BestNeighborhood data science team. Full methodology and findings: political spectrum map.
Methodology reviewed by the BestNeighborhood data team. Last updated May 2026.