Fordham leans heavily Democratic by roughly 36 points: about 68% of voters vote Democratic and 32% Republican.
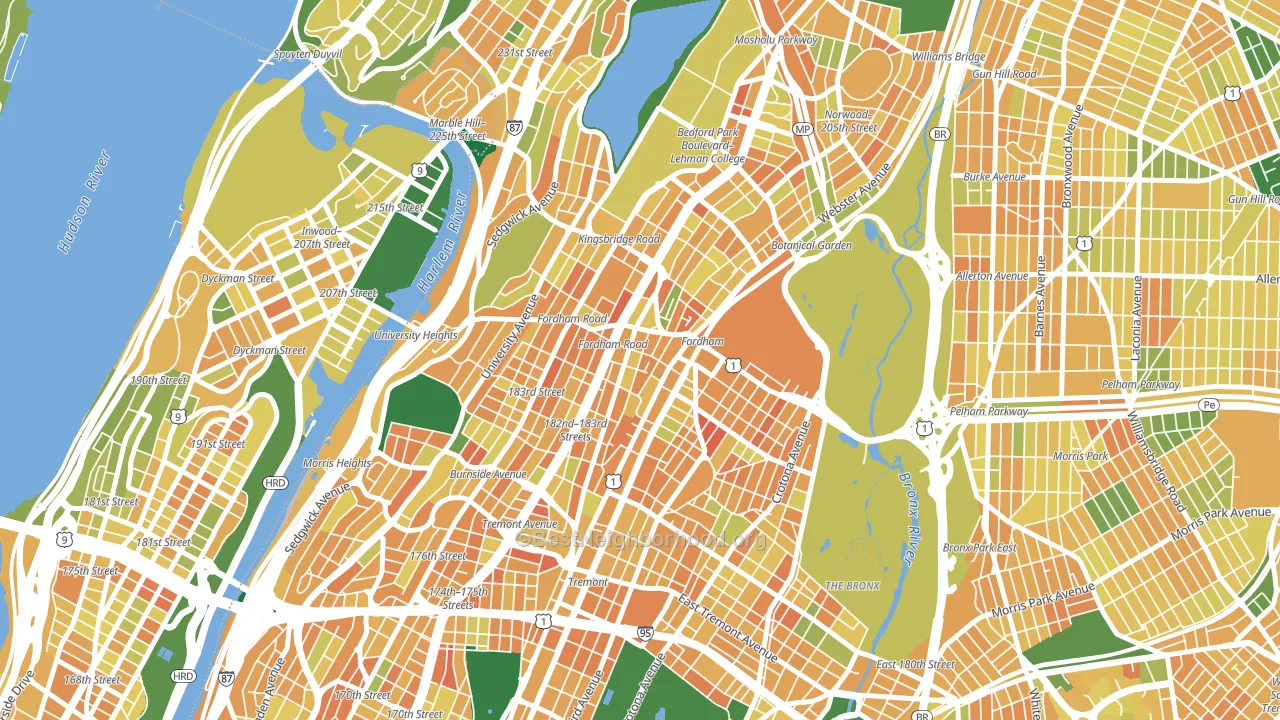
About 33% of adults in Fordham typically vote, below the U.S. average of about 62%. Among adults in Fordham, ~22% vote Democratic, ~11% Republican, and ~67% don't vote. The map below shows estimated turnout by block group.
How Fordham compares
Among neighborhoods within 5 miles, Fordham leans more Democratic than 18 of 44 neighbors.
Fordham runs about 24 points more Democratic than New York as a whole.
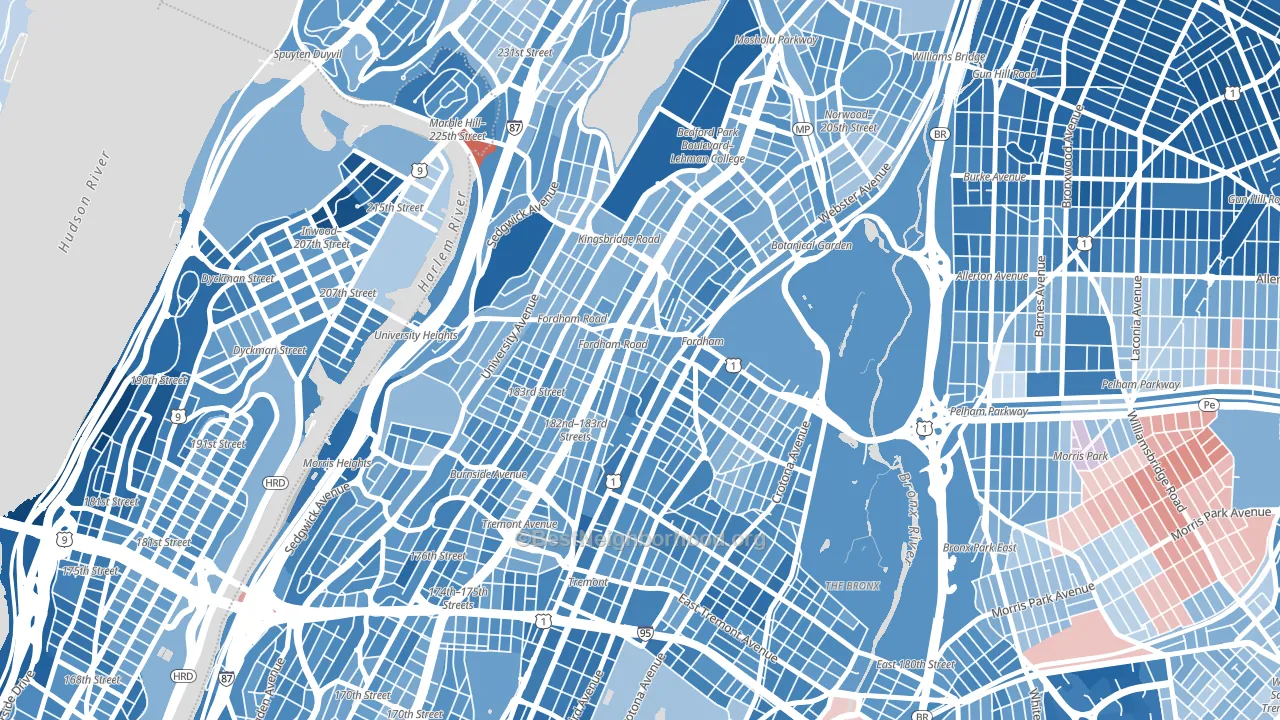
Politics vary noticeably by block within Fordham. The south side is the most Democratic-leaning (D+47) and the northwest side is the least Democratic-leaning (D+31), a spread of about 16 points.
Why Fordham leans the way it does
This analysis examined 14,881 data points per neighborhood to find what predicts political lean and turnout. The items below are a few correlations that stood out for Fordham, not a ranked or complete list of what matters most.
Dense areas vote Democratic. More than 99% of residents in Fordham live in densely developed areas, about 64 points above the U.S. average of 36%. A high never-married share predicts Democratic voting, and about 51% of adults in Fordham have never been married, above 83% of neighborhoods.
Preventive-care access and voter turnout
Places with limited routine preventive-care access tend to turn out at a lower rate; Fordham, Bronx, NY sits in the bottom tenth nationally on this measure. Dental visits do not drive turnout; the rate reflects income, insurance, and healthcare access, which line up with who votes.
Why turnout in Fordham looks the way it does
Areas with limited routine healthcare access turn out at lower rates. Fordham is in the bottom quarter nationally for routine-care measures such as insurance coverage, preventive screenings, and dental visits. The dental-visit rate here is about 43%, about 21 points below the New York average of 64%. Renters vote less often than owners, and about 97% of households in Fordham rent, about 72 points above the U.S. average of 25%. High food insecurity lines up with lower turnout, and about 48% of adults in Fordham report food insecurity, above 98% of neighborhoods. Learn more about the findings and methodology on the political spectrum map.
Nearby Neighborhoods
- Belmont, Bronx, NY D+43
- University Heights, Bronx, NY D+31
- Tremont, Bronx, NY D+43
- Bedford Park, Bronx, NY D+33
- Morris Heights, Bronx, NY D+43
- Inwood, Manhattan, NY D+47
- Kings Bridge, Bronx, NY D+31
- Bronxdale, Bronx, NY D+31
- Williamsbridge, Bronx, NY D+47
- Spuyten Duyvil, Bronx, NY D+49
Neighborhoods with Similar Populations
- Southeast Arlington, Arlington, TX D+26
- Western Addition, San Francisco, CA D+73
- Gramercy, Manhattan, NY D+65
- Centennial Hills, Las Vegas, NV Even
- The Heights, Jersey City, NJ D+30
- Flagami, Miami, FL R+35
- Santa Teresa, San Jose, CA D+26
- Otay Ranch, Chula Vista, CA D+16
- Fresno-High, Fresno, CA D+23
- Woodward Park, Fresno, CA R+7
Sources and methodology
Precinct-level voting records used to fit the model come from New York State Board of Elections, distributed by the Voting and Election Science Team. Demographic inputs come from the U.S. Census Bureau (ACS 5-year estimates and the 2020 Decennial Census). Health and environmental inputs come from the CDC (PLACES and the Environmental Justice Index). Land cover comes from the USGS and EPA. Election-day and lead-up weather come from PRISM 4km daily grids and the NOAA Global Historical Climatology Network. Mail-voting and election-administration patterns come from the MIT Election Lab's Survey of the Performance of American Elections. Block-group crime detail comes from CrimeGrade. Internet data and modeling support provided by ISPreports.org.
Modeling and analysis by the BestNeighborhood data science team. Full methodology and findings: political spectrum map.
Methodology reviewed by the BestNeighborhood data team. Last updated May 2026.