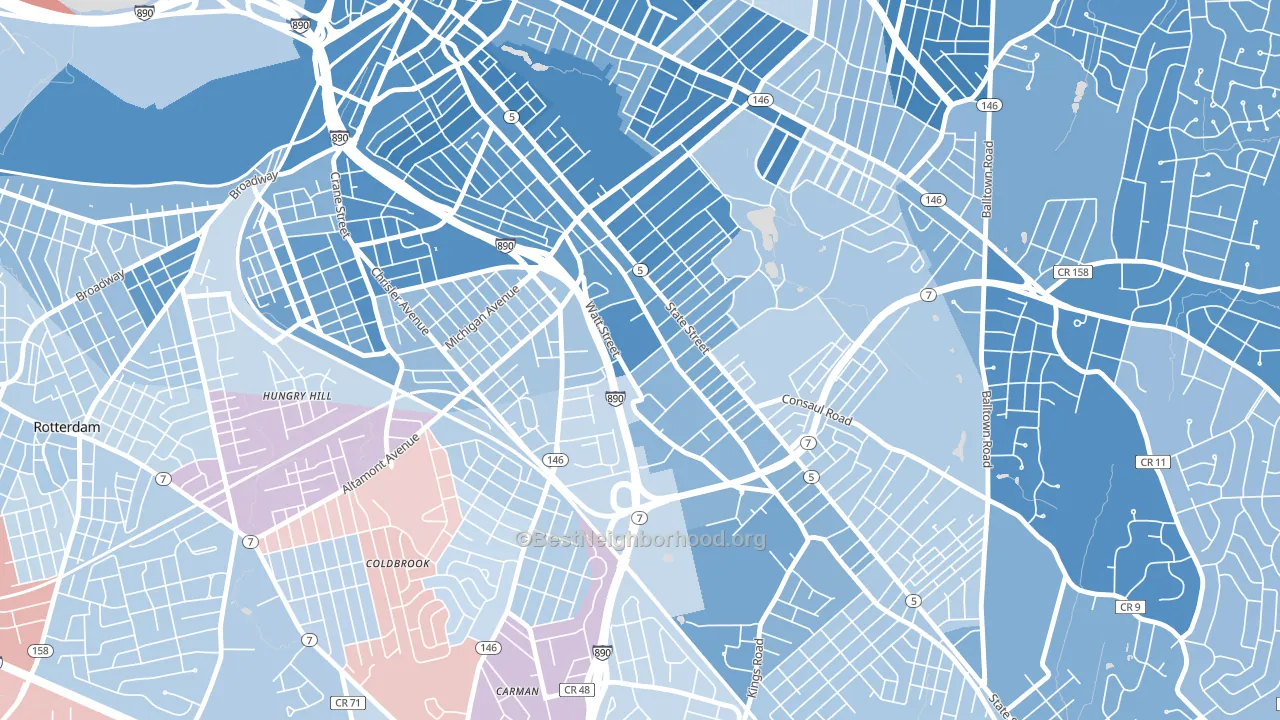
Central State leans heavily Democratic by roughly 30 points: about 65% of voters vote Democratic and 35% Republican.
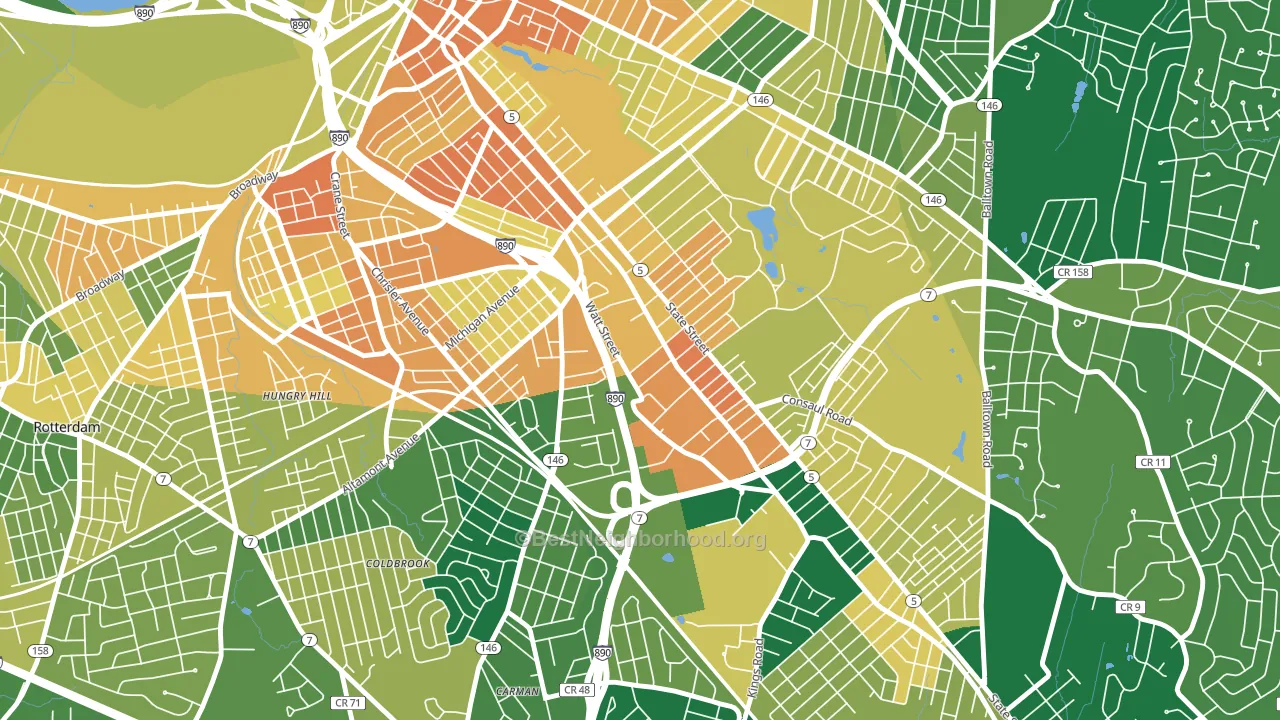
About 38% of adults in Central State typically vote, below the U.S. average of about 62%. Among adults in Central State, ~25% vote Democratic, ~13% Republican, and ~62% don't vote. The map below shows estimated turnout by block group.
How Central State compares
Central State sits in a sparsely populated area with few comparable neighborhoods nearby.
Central State runs about 18 points more Democratic than New York as a whole.
Politics vary noticeably by block within Central State. The north side is the most Democratic-leaning (D+35) and the south side is the least Democratic-leaning (D+7), a spread of about 28 points.
Why Central State leans the way it does
This analysis examined 14,881 data points per neighborhood to find what predicts political lean and turnout. The items below are a few correlations that stood out for Central State, not a ranked or complete list of what matters most.
Dense areas vote Democratic. More than 99% of residents in Central State live in densely developed areas, about 64 points above the U.S. average of 36%.
Paved land cover and Democratic lean
Places with extensive paved surfaces tend to lean Democratic; Central State, Schenectady, NY sits in the top quarter nationally on this measure. Paved ground does not change how people vote; it mostly reflects how urban and built-up a place is.
Why turnout in Central State looks the way it does
Areas with high food insecurity turn out at lower rates. About 30% of adults in Central State report food insecurity, about 14 points above the U.S. average of 16%. Low high-school completion lines up with lower turnout, and about 83% of adults in Central State have completed high school, below 80% of neighborhoods. Learn more about the findings and methodology on the political spectrum map.
Nearby Neighborhoods
- Hamilton Hills, Schenectady, NY D+42
- Vale and Eastern Avenue, Schenectady, NY D+42
- Campus Area, Albany, NY D+47
- Buckingham Lake-Crestwood, Albany, NY D+47
- West End, Albany, NY D+61
- New Scotland-Woodlawn, Albany, NY D+60
- Pine Hills, Albany, NY D+62
- Helderberg, Albany, NY D+57
- West Hill, Albany, NY D+66
- Central Ave, Albany, NY D+66
Neighborhoods with Similar Populations
- Southpoint, Milwaukee, WI D+19
- Village Park, McKinney, TX D+2
- Lynn Knoll, Aurora, CO D+30
- Northwest Ridgewood, Ridgewood, NJ D+29
- South Central Accord, Columbus, OH R+20
- Broadmoor, Daly City, CA D+36
- Greater Oakhill, Evansville, IN R+18
- Hyde Park, Pueblo, CO D+6
- Stoneybrook West, Winter Garden, FL Even
- Saunders, Newport News, VA D+22
Sources and methodology
Precinct-level voting records used to fit the model come from New York State Board of Elections, distributed by the Voting and Election Science Team. Demographic inputs come from the U.S. Census Bureau (ACS 5-year estimates and the 2020 Decennial Census). Health and environmental inputs come from the CDC (PLACES and the Environmental Justice Index). Land cover comes from the USGS and EPA. Election-day and lead-up weather come from PRISM 4km daily grids and the NOAA Global Historical Climatology Network. Mail-voting and election-administration patterns come from the MIT Election Lab's Survey of the Performance of American Elections. Block-group crime detail comes from CrimeGrade. Internet data and modeling support provided by ISPreports.org.
Modeling and analysis by the BestNeighborhood data science team. Full methodology and findings: political spectrum map.
Methodology reviewed by the BestNeighborhood data team. Last updated May 2026.