Broadmoor leans heavily Democratic by roughly 36 points: about 68% of voters vote Democratic and 32% Republican.
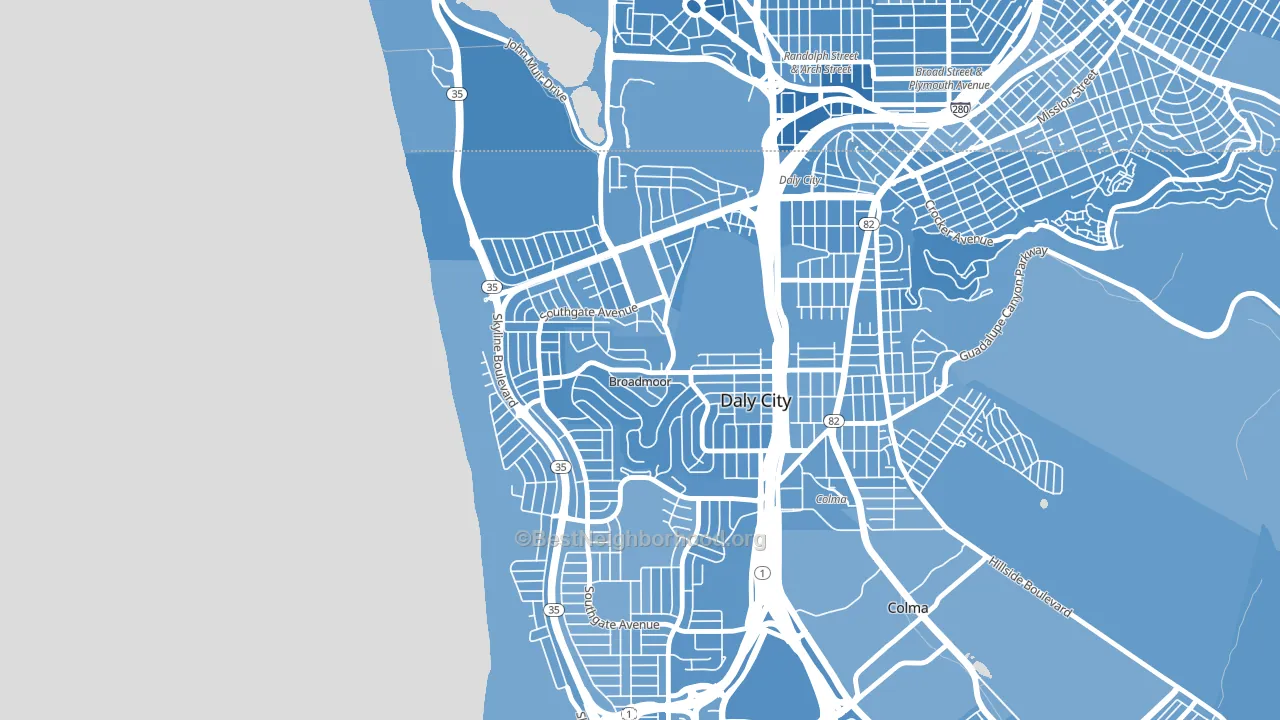
About 49% of adults in Broadmoor typically vote, below the U.S. average of about 62%. Among adults in Broadmoor, ~33% vote Democratic, ~16% Republican, and ~51% don't vote. The map below shows estimated turnout by block group.
How Broadmoor compares
Among neighborhoods within 5 miles, Broadmoor leans more Democratic than 3 of 34 neighbors.
Broadmoor runs about 16 points more Democratic than California as a whole.
Why Broadmoor leans the way it does
Density, race composition, education, and family structure all sit close to their national averages in Broadmoor. The lean here lands roughly where demographic data alone would predict.
Park access and Democratic lean
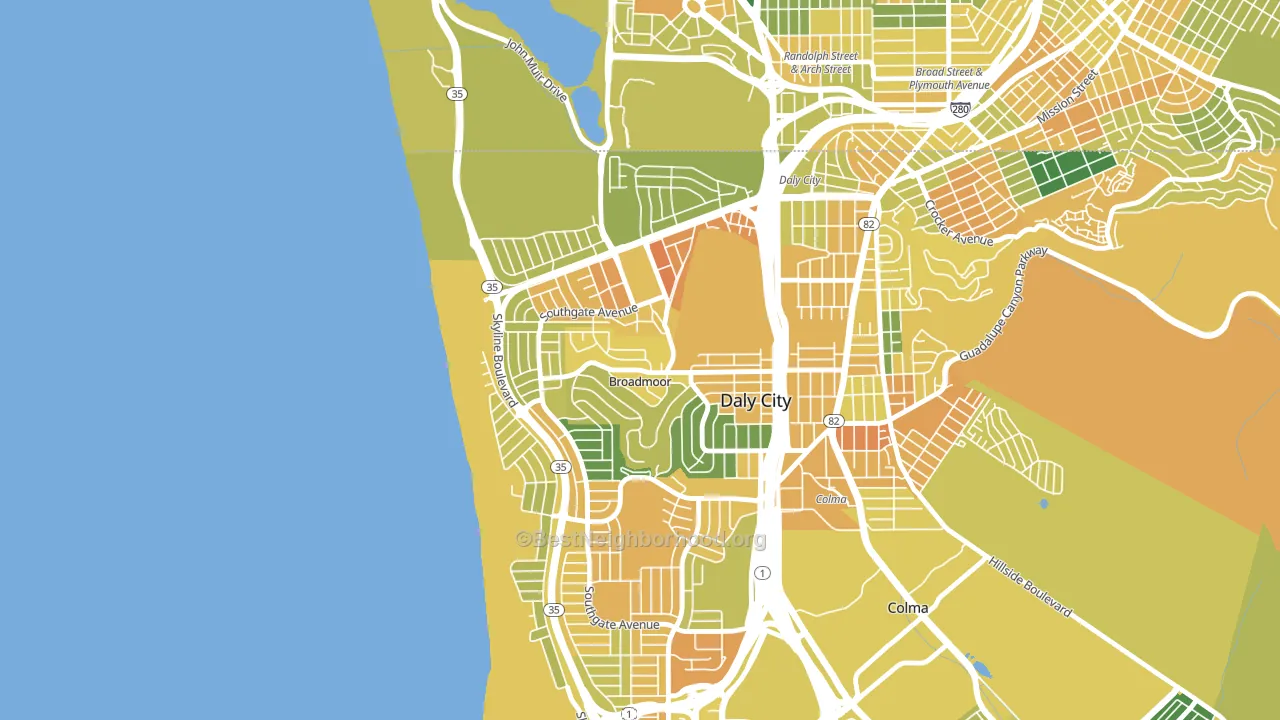
Places with heavy park coverage tend to lean Democratic; Broadmoor, Daly City, CA sits in the top quarter nationally on this measure. Park access does not change how people vote; it tends to track denser, higher-income areas.
Why turnout in Broadmoor looks the way it does
Crowded housing lines up with lower turnout. About 23% of homes in Broadmoor have more than one occupant per room, in the top fraction of neighborhoods. Learn more about the findings and methodology on the political spectrum map.
Nearby Neighborhoods
- Westlake-San Francisco, Daly City, CA D+40
- St. Francis, Daly City, CA D+35
- Original Daly City, Daly City, CA D+40
- Hillside, Daly City, CA D+39
- Ocean View, San Francisco, CA D+45
- Lakeshore, San Francisco, CA D+49
- Crocker, Daly City, CA D+42
- Fairmont, Pacifica, CA D+38
- Serramonte, Daly City, CA D+36
- Ingleside, San Francisco, CA D+50
Neighborhoods with Similar Populations
- Greater Oakhill, Evansville, IN R+18
- Lynn Knoll, Aurora, CO D+30
- Southpoint, Milwaukee, WI D+19
- Central State, Schenectady, NY D+30
- Village Park, McKinney, TX D+2
- Northwest Ridgewood, Ridgewood, NJ D+29
- Magnolia Gardens, Jacksonville, FL D+84
- South Central Accord, Columbus, OH R+20
- Stoneybrook West, Winter Garden, FL Even
- Woodbury-Glendale, Glendale, CA D+26
Sources and methodology
Precinct-level voting records used to fit the model come from California Secretary of State, Elections, distributed by the Voting and Election Science Team. Demographic inputs come from the U.S. Census Bureau (ACS 5-year estimates and the 2020 Decennial Census). Health and environmental inputs come from the CDC (PLACES and the Environmental Justice Index). Land cover comes from the USGS and EPA. Election-day and lead-up weather come from PRISM 4km daily grids and the NOAA Global Historical Climatology Network. Mail-voting and election-administration patterns come from the MIT Election Lab's Survey of the Performance of American Elections. Block-group crime detail comes from CrimeGrade. Internet data and modeling support provided by ISPreports.org.
Modeling and analysis by the BestNeighborhood data science team. Full methodology and findings: political spectrum map.
Methodology reviewed by the BestNeighborhood data team. Last updated May 2026.