Stoneybrook West is a true toss-up. About 49% of voters here vote Democratic and 51% Republican.
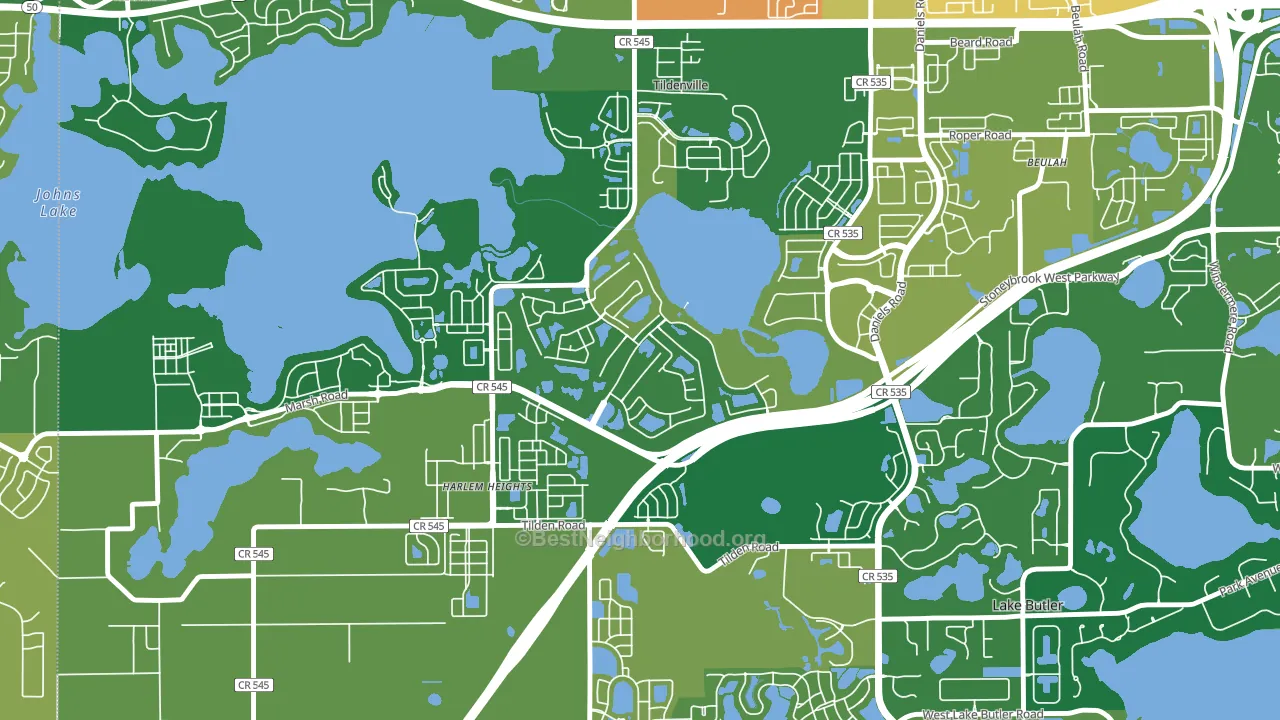
About 90% of adults in Stoneybrook West typically vote, above the U.S. average of about 62%. Among adults in Stoneybrook West, ~44% vote Democratic, ~46% Republican, and ~10% don't vote. The map below shows estimated turnout by block group.
How Stoneybrook West compares
Among neighborhoods within 5 miles, Stoneybrook West sits roughly in the middle of the political spectrum, with 0 neighbors leaning further in the place's direction and 2 leaning the other way.
Stoneybrook West runs about 11 points more Democratic than Florida as a whole.
Why Stoneybrook West leans the way it does
Density, race composition, education, and family structure all sit close to their national averages in Stoneybrook West. The lean here lands roughly where demographic data alone would predict.
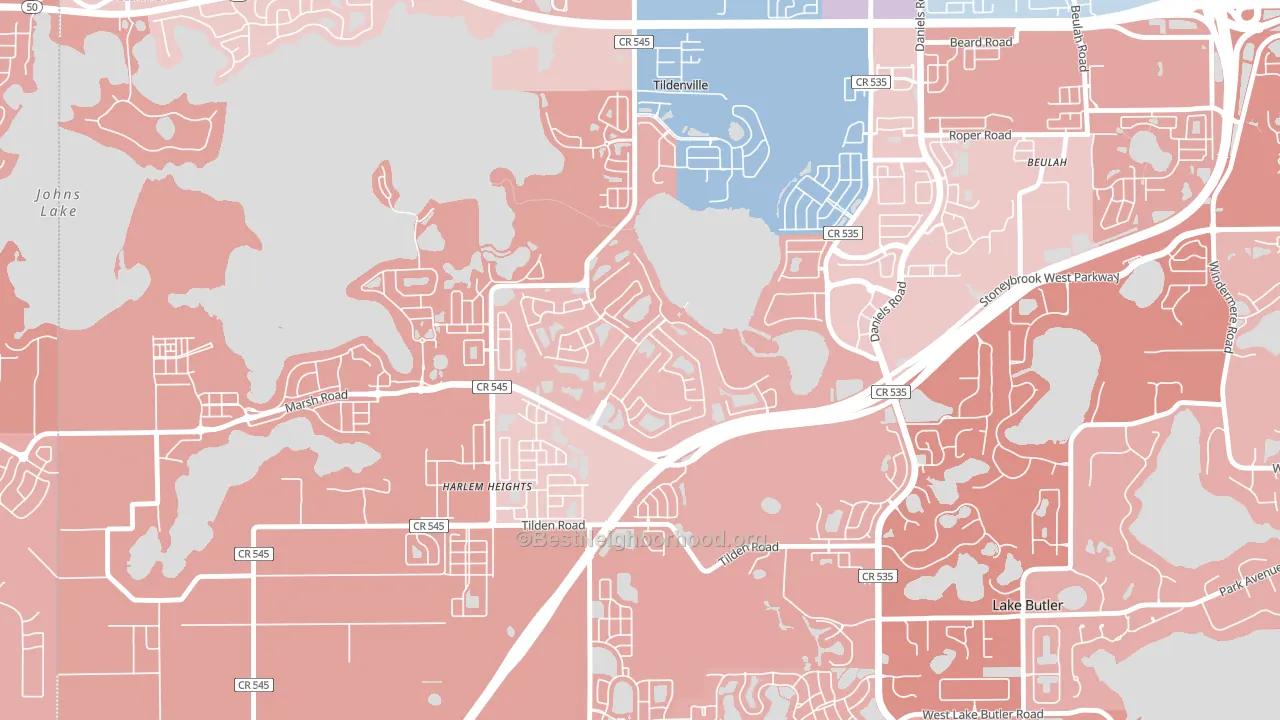
Park access and Republican lean
Places with low park coverage tend to lean Republican; Stoneybrook West, Winter Garden, FL sits in the bottom quarter nationally on this measure. Park access does not change how people vote; it tends to track denser, higher-income areas.
Why turnout in Stoneybrook West looks the way it does
Areas with high high-school completion turn out at higher rates. About 99% of adults in Stoneybrook West have completed high school, about 10 points above the Florida average of 89%. Learn more about the findings and methodology on the political spectrum map.
Nearby Neighborhoods
- Eden Isle, Horizon West, FL R+6
- Signature Lakes, Horizon West, FL R+6
- Lost Lake, Clermont, FL R+10
- Westland Terrace, Pine Hills, FL D+70
- Metro West, Orlando, FL D+20
- Kirkman South, Orlando, FL D+8
- Kirkman North, Orlando, FL D+53
- Florida Center, Orlando, FL D+21
- Camellia Gardens, Orlando, FL D+57
- Florida Center North, Orlando, FL D+24
Neighborhoods with Similar Populations
- Saunders, Newport News, VA D+22
- Hyde Park, Pueblo, CO D+6
- South Central Accord, Columbus, OH R+20
- McLoughlin, Oregon City, OR D+33
- Northwest Ridgewood, Ridgewood, NJ D+29
- North Central, Wichita, KS D+72
- Fort Myers Villas, Villas, FL R+17
- Central State, Schenectady, NY D+30
- Marshall-Shadeland, Pittsburgh, PA D+56
- Cactus Gale, Glendale, AZ R+11
Sources and methodology
Precinct-level voting records used to fit the model come from Florida Division of Elections, distributed by the Voting and Election Science Team. Demographic inputs come from the U.S. Census Bureau (ACS 5-year estimates and the 2020 Decennial Census). Health and environmental inputs come from the CDC (PLACES and the Environmental Justice Index). Land cover comes from the USGS and EPA. Election-day and lead-up weather come from PRISM 4km daily grids and the NOAA Global Historical Climatology Network. Mail-voting and election-administration patterns come from the MIT Election Lab's Survey of the Performance of American Elections. Block-group crime detail comes from CrimeGrade. Internet data and modeling support provided by ISPreports.org.
Modeling and analysis by the BestNeighborhood data science team. Full methodology and findings: political spectrum map.
Methodology reviewed by the BestNeighborhood data team. Last updated May 2026.