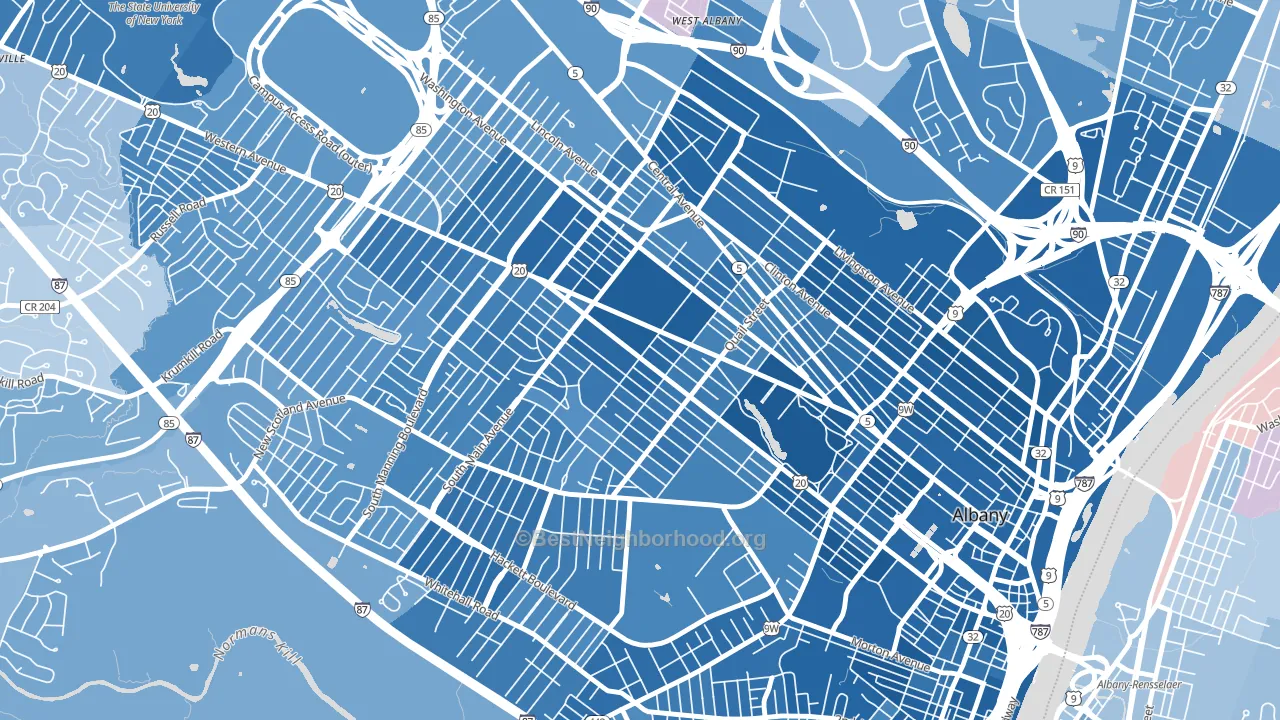
Pine Hills is a Democratic stronghold. About 81% of voters here vote Democratic and 19% Republican.
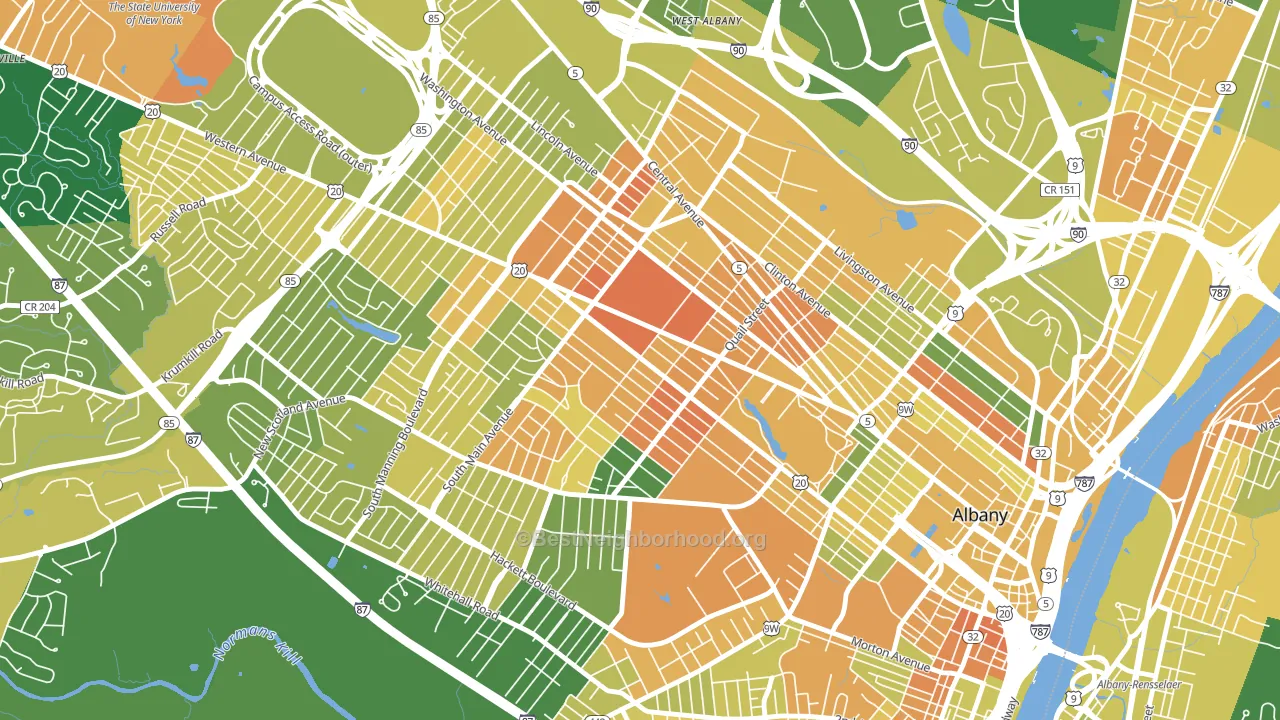
About 35% of adults in Pine Hills typically vote, below the U.S. average of about 62%. Among adults in Pine Hills, ~28% vote Democratic, ~7% Republican, and ~65% don't vote. The map below shows estimated turnout by block group.
How Pine Hills compares
Among neighborhoods within 5 miles, Pine Hills leans more Democratic than 6 of 12 neighbors.
Pine Hills runs about 49 points more Democratic than New York as a whole.
Why Pine Hills leans the way it does
This analysis examined 14,881 data points per neighborhood to find what predicts political lean and turnout. The items below are a few correlations that stood out for Pine Hills, not a ranked or complete list of what matters most.
Dense areas vote Democratic. More than 99% of residents in Pine Hills live in densely developed areas, about 64 points above the U.S. average of 36%. A high never-married share predicts Democratic voting, and about 78% of adults in Pine Hills have never been married, in the top fraction of neighborhoods.
Population density and Democratic lean
Places with high population density tend to lean Democratic; Pine Hills, Albany, NY sits in the top tenth nationally on this measure.
Why turnout in Pine Hills looks the way it does
Renters vote less often than owners. About 73% of households in Pine Hills rent, about 48 points above the U.S. average of 25%. Learn more about the findings and methodology on the political spectrum map.
Nearby Neighborhoods
- New Scotland-Woodlawn, Albany, NY D+60
- West End, Albany, NY D+61
- Helderberg, Albany, NY D+57
- Central Ave, Albany, NY D+66
- West Hill, Albany, NY D+66
- Sheridan Hollow, Albany, NY D+71
- Center Square, Albany, NY D+75
- Buckingham Lake-Crestwood, Albany, NY D+47
- Delaware Avenue, Albany, NY D+58
- Arbor Hill, Albany, NY D+77
Neighborhoods with Similar Populations
- Maple Leaf, Seattle, WA D+78
- Congress Heights, Washington, DC D+86
- Martin Luther King, Austin, TX D+64
- Home Park, Atlanta, GA D+60
- South Semoran, Orlando, FL D+13
- South Ironbound, Newark, NJ D+25
- Park Hills, Yonkers, NY D+28
- Harmony Village, Detroit, MI D+87
- South Redlands, Redlands, CA Even
- North West Long Beach, Long Beach, CA D+49
Sources and methodology
Precinct-level voting records used to fit the model come from New York State Board of Elections, distributed by the Voting and Election Science Team. Demographic inputs come from the U.S. Census Bureau (ACS 5-year estimates and the 2020 Decennial Census). Health and environmental inputs come from the CDC (PLACES and the Environmental Justice Index). Land cover comes from the USGS and EPA. Election-day and lead-up weather come from PRISM 4km daily grids and the NOAA Global Historical Climatology Network. Mail-voting and election-administration patterns come from the MIT Election Lab's Survey of the Performance of American Elections. Block-group crime detail comes from CrimeGrade. Internet data and modeling support provided by ISPreports.org.
Modeling and analysis by the BestNeighborhood data science team. Full methodology and findings: political spectrum map.
Methodology reviewed by the BestNeighborhood data team. Last updated May 2026.