Chabot Terrace leans heavily Democratic by roughly 48 points: about 74% of voters vote Democratic and 26% Republican.
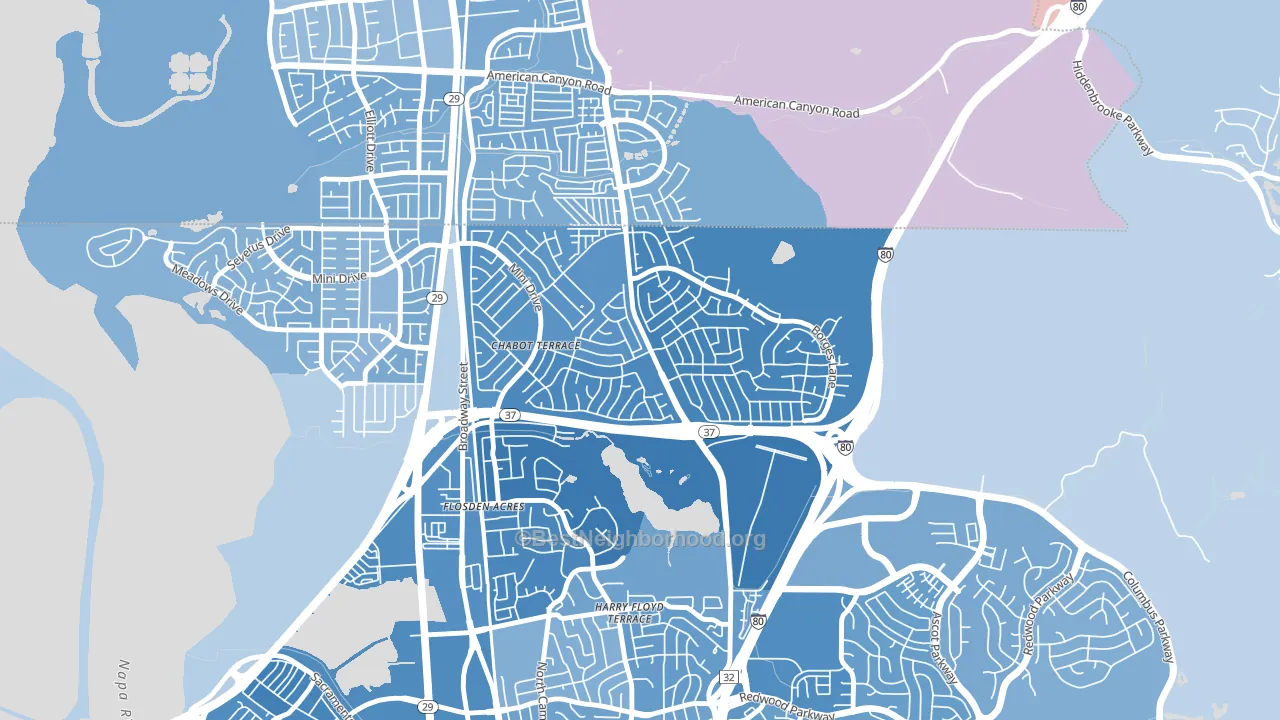
About 53% of adults in Chabot Terrace typically vote, below the U.S. average of about 62%. Among adults in Chabot Terrace, ~39% vote Democratic, ~14% Republican, and ~47% don't vote. The map below shows estimated turnout by block group.
How Chabot Terrace compares
Among neighborhoods within 5 miles, Chabot Terrace is the most Democratic-leaning.
Chabot Terrace runs about 28 points more Democratic than California as a whole.
Why Chabot Terrace leans the way it does
Density, race composition, education, and family structure all sit close to their national averages in Chabot Terrace. The lean here lands roughly where demographic data alone would predict.
Paved land cover and Democratic lean
Places with extensive paved surfaces tend to lean Democratic; Chabot Terrace, Vallejo, CA sits above the national average on this measure. Paved ground does not change how people vote; it mostly reflects how urban and built-up a place is.
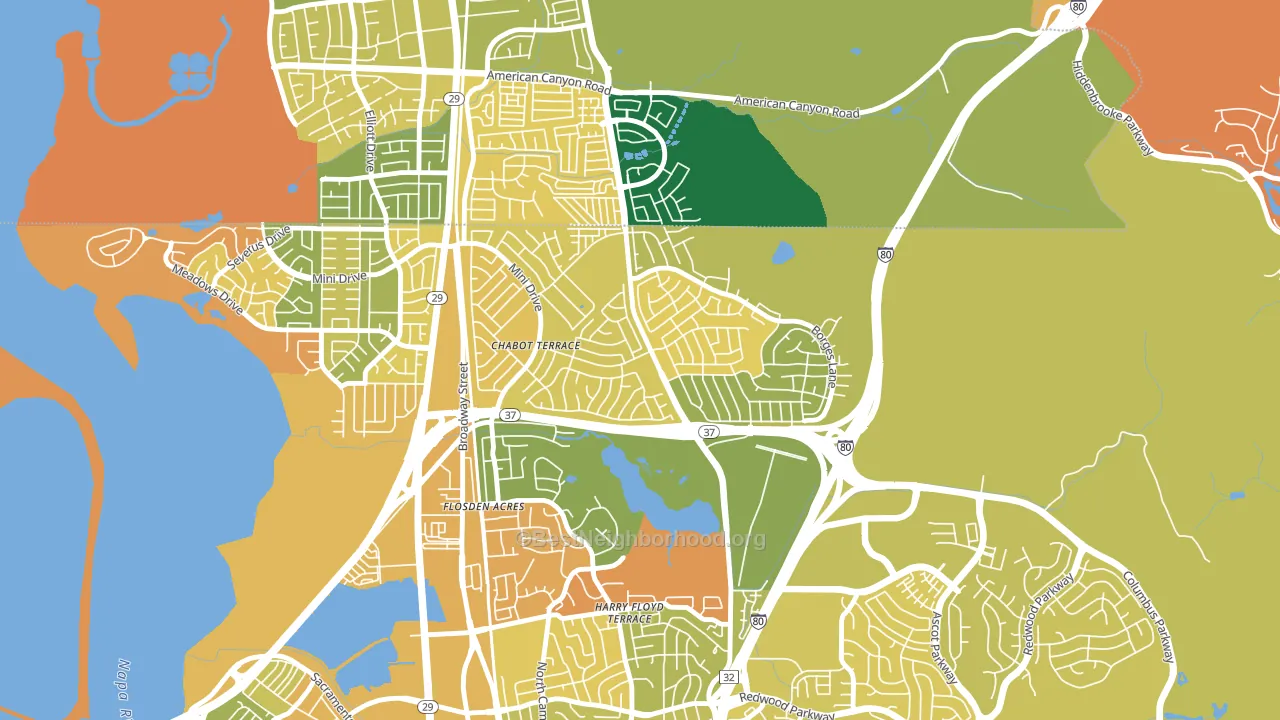
Why turnout in Chabot Terrace looks the way it does
Crowded housing lines up with lower turnout. About 6% of homes in Chabot Terrace have more than one occupant per room, above 83% of neighborhoods. Learn more about the findings and methodology on the political spectrum map.
Nearby Neighborhoods
- Harry Floyd Terrace, Vallejo, CA D+42
- Flosden, Vallejo, CA D+26
- Carquinez Heights, Vallejo, CA D+45
- Glencove, Vallejo, CA D+40
- Terrace-Shurtleff, Napa, CA D+36
- Westwood-San Francisco, Napa, CA D+35
- Central Napa, Napa, CA D+39
- Tara Hills, San Pablo, CA D+35
- Beard, Napa, CA D+37
- Browns Valley, Napa, CA D+30
Neighborhoods with Similar Populations
- People's Freeway, Salt Lake City, UT D+47
- Winkler Safe Neighborhood, Fort Myers, FL D+18
- Circle Cross Ranch, San Tan Valley, AZ R+22
- Southside Flats, Pittsburgh, PA D+55
- Meadowdale, Lynnwood, WA D+25
- Crieve Hall, Nashville, TN D+7
- Federal Hill, Providence, RI D+60
- Landover-Sharmel, Vancouver, WA D+22
- Saint Louis Hills, St. Louis, MO D+33
- Irvine Health and Science Complex, Irvine, CA D+23
Sources and methodology
Precinct-level voting records used to fit the model come from California Secretary of State, Elections, distributed by the Voting and Election Science Team. Demographic inputs come from the U.S. Census Bureau (ACS 5-year estimates and the 2020 Decennial Census). Health and environmental inputs come from the CDC (PLACES and the Environmental Justice Index). Land cover comes from the USGS and EPA. Election-day and lead-up weather come from PRISM 4km daily grids and the NOAA Global Historical Climatology Network. Mail-voting and election-administration patterns come from the MIT Election Lab's Survey of the Performance of American Elections. Block-group crime detail comes from CrimeGrade. Internet data and modeling support provided by ISPreports.org.
Modeling and analysis by the BestNeighborhood data science team. Full methodology and findings: political spectrum map.
Methodology reviewed by the BestNeighborhood data team. Last updated May 2026.