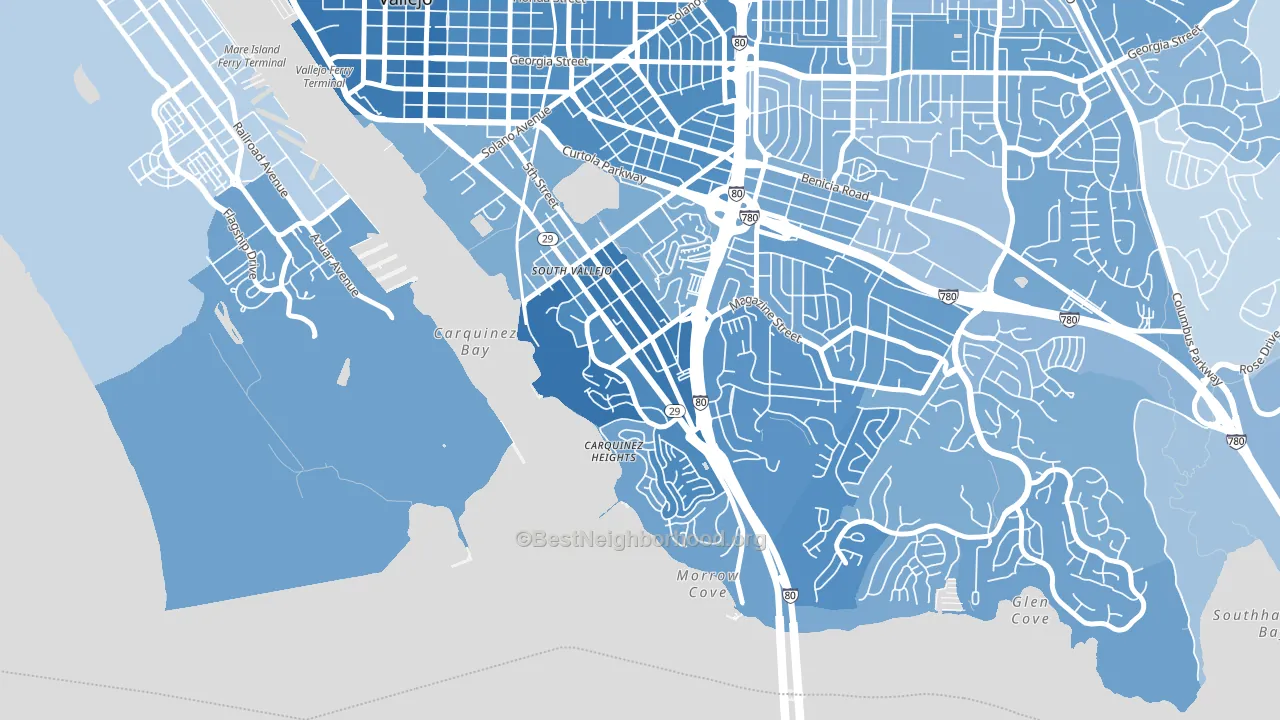
Carquinez Heights leans heavily Democratic by roughly 44 points: about 72% of voters vote Democratic and 28% Republican.
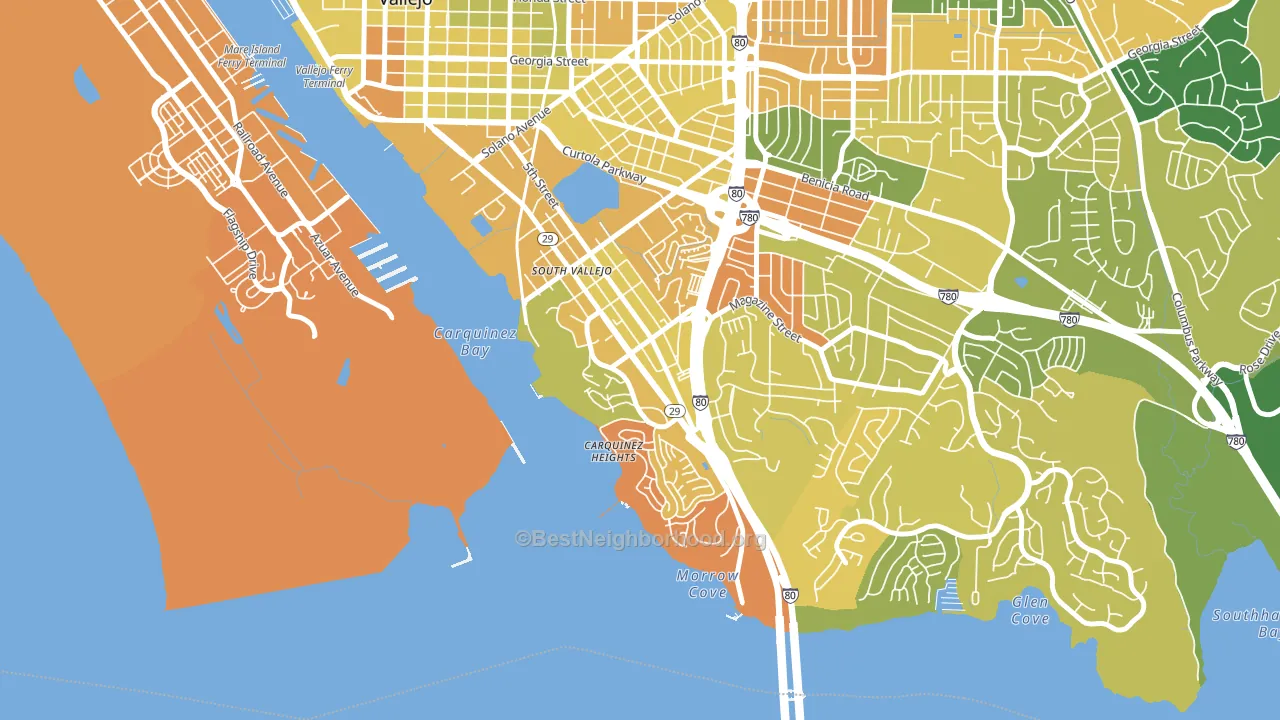
About 39% of adults in Carquinez Heights typically vote, below the U.S. average of about 62%. Among adults in Carquinez Heights, ~28% vote Democratic, ~11% Republican, and ~61% don't vote. The map below shows estimated turnout by block group.
How Carquinez Heights compares
Among neighborhoods within 5 miles, Carquinez Heights leans more Democratic than 3 of 4 neighbors.
Carquinez Heights runs about 25 points more Democratic than California as a whole.
Politics vary noticeably by block within Carquinez Heights. The southwest side is the most Democratic-leaning (D+56) and the northeast side is the least Democratic-leaning (D+33), a spread of about 23 points.
Why Carquinez Heights leans the way it does
This analysis examined 14,881 data points per neighborhood to find what predicts political lean and turnout. The items below are a few correlations that stood out for Carquinez Heights, not a ranked or complete list of what matters most.
Areas with many never-married adults vote Democratic. About 50% of adults in Carquinez Heights have never been married, modestly above similar-sized neighborhoods (around 38%).
Cancer-screening access and voter turnout
Places with low colon-cancer-screening access tend to turn out at a lower rate; Carquinez Heights, Vallejo, CA sits in the bottom quarter nationally on this measure. Cancer screening does not drive turnout; it reflects income, insurance, and healthcare access.
Why turnout in Carquinez Heights looks the way it does
Crowded housing lines up with lower turnout. About 6% of homes in Carquinez Heights have more than one occupant per room, above 82% of neighborhoods. Learn more about the findings and methodology on the political spectrum map.
Nearby Neighborhoods
- Glencove, Vallejo, CA D+40
- Harry Floyd Terrace, Vallejo, CA D+42
- Chabot Terrace, Vallejo, CA D+48
- Flosden, Vallejo, CA D+26
- Tara Hills, San Pablo, CA D+35
- Fairmede-Hilltop, San Pablo, CA D+56
- East Richmond, Richmond, CA D+66
- North and East, Richmond, CA D+55
- Pacheco-Martinez, Martinez, CA D+32
- Belding Woods, Richmond, CA D+49
Neighborhoods with Similar Populations
- Wellswood, Tampa, FL D+2
- Gresham-Kelly Creek, Gresham, OR D+4
- Crystal Springs, Jacksonville, FL R+3
- Union Park, Des Moines, IA D+15
- Royal Highlands, Brooksville, FL R+46
- Euclid-St Paul, St. Petersburg, FL D+18
- Bronze Boot, Phoenix, AZ D+36
- Queensborough, Shreveport, LA D+84
- Central Street Merchant District, Evanston, IL D+77
- Carondelet, St. Louis, MO D+51
Sources and methodology
Precinct-level voting records used to fit the model come from California Secretary of State, Elections, distributed by the Voting and Election Science Team. Demographic inputs come from the U.S. Census Bureau (ACS 5-year estimates and the 2020 Decennial Census). Health and environmental inputs come from the CDC (PLACES and the Environmental Justice Index). Land cover comes from the USGS and EPA. Election-day and lead-up weather come from PRISM 4km daily grids and the NOAA Global Historical Climatology Network. Mail-voting and election-administration patterns come from the MIT Election Lab's Survey of the Performance of American Elections. Block-group crime detail comes from CrimeGrade. Internet data and modeling support provided by ISPreports.org.
Modeling and analysis by the BestNeighborhood data science team. Full methodology and findings: political spectrum map.
Methodology reviewed by the BestNeighborhood data team. Last updated May 2026.