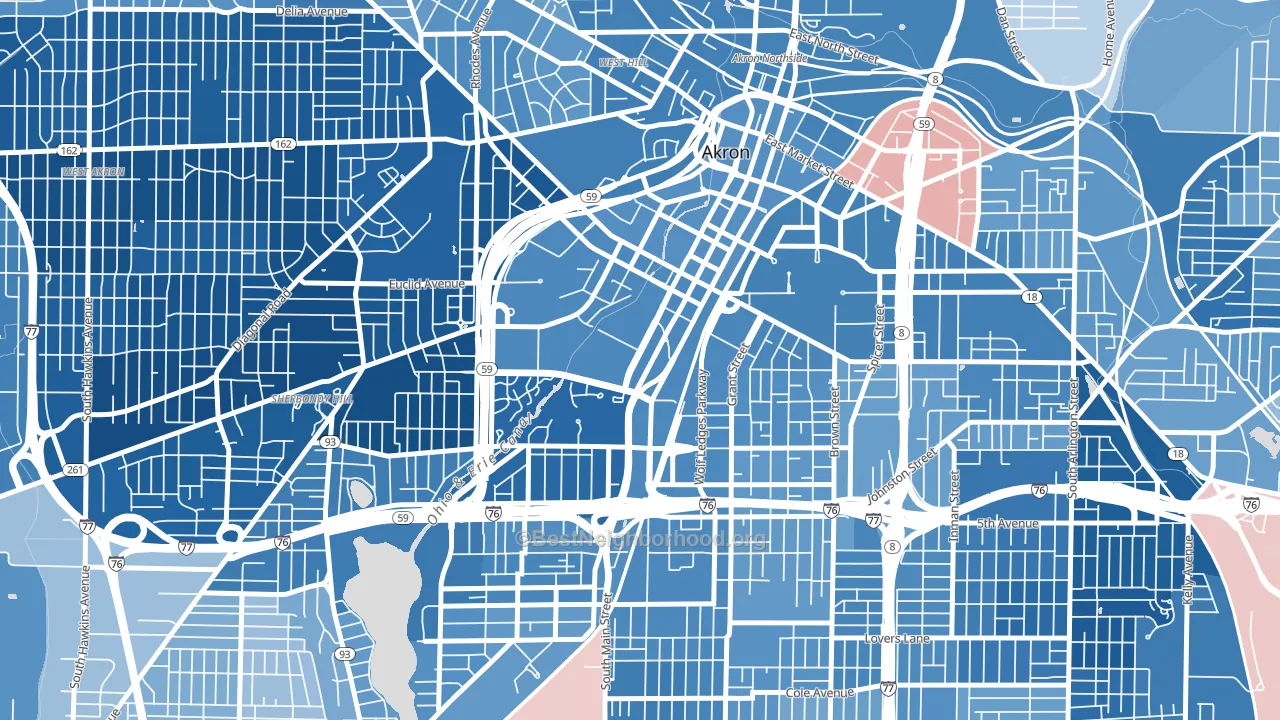
Downtown Akron is a Democratic stronghold. About 81% of voters here vote Democratic and 19% Republican.
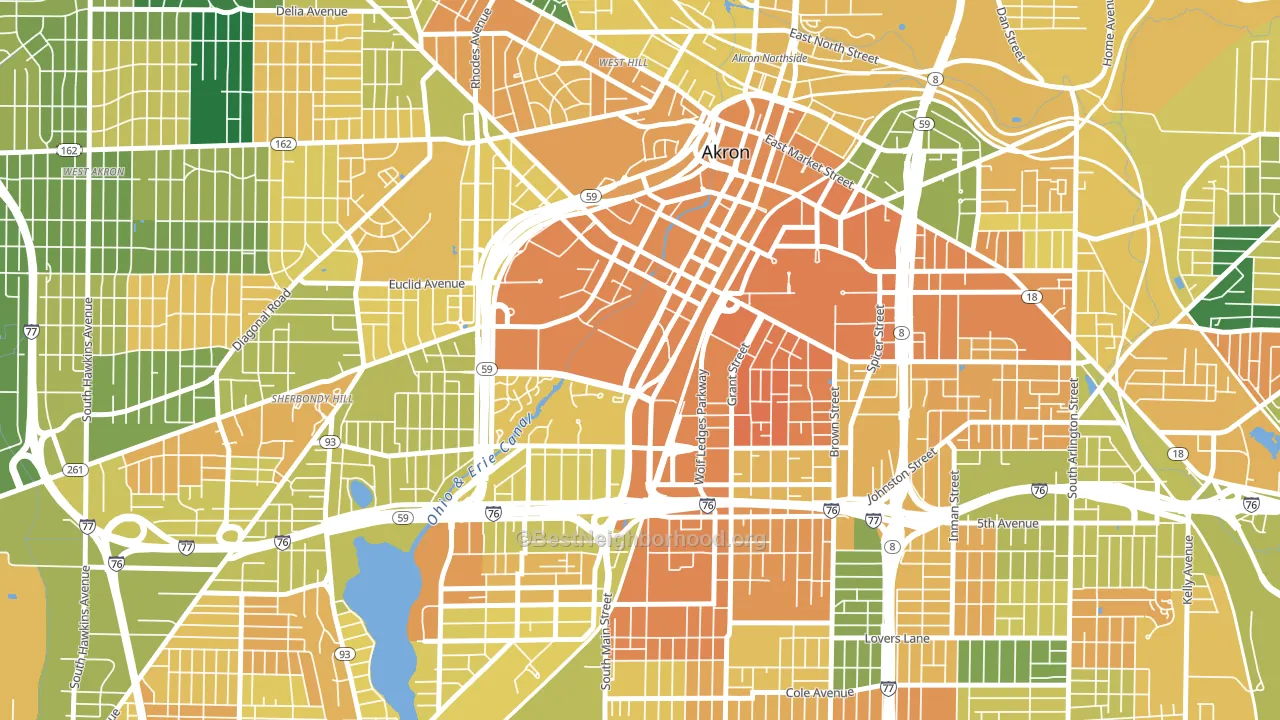
About 33% of adults in Downtown Akron typically vote, below the U.S. average of about 62%. Among adults in Downtown Akron, ~27% vote Democratic, ~6% Republican, and ~67% don't vote. The map below shows estimated turnout by block group.
How Downtown Akron compares
Among neighborhoods within 5 miles, Downtown Akron leans more Democratic than 16 of 18 neighbors.
Downtown Akron runs about 73 points more Democratic than Ohio as a whole. Ohio leans Republican overall, while Downtown Akron is one of the few Democratic-leaning pockets.
Politics vary noticeably by block within Downtown Akron. The southwest side is the most Democratic-leaning (D+77) and the northeast side is the least Democratic-leaning (D+51), a spread of about 26 points.
Why Downtown Akron leans the way it does
This analysis examined 14,881 data points per neighborhood to find what predicts political lean and turnout. The items below are a few correlations that stood out for Downtown Akron, not a ranked or complete list of what matters most.
Dense areas vote Democratic. More than 99% of residents in Downtown Akron live in densely developed areas, about 64 points above the U.S. average of 36%. A high never-married share predicts Democratic voting, and about 62% of adults in Downtown Akron have never been married, above 94% of neighborhoods. Downtown Akron runs against the grain of Ohio, a Democratic-leaning pocket in a Republican-leaning state.
Never-married share, developed land, and voter turnout
Places that combine a never-married-heavy adult population and a heavily developed built environment tend to turn out at a lower rate, as Downtown Akron, Akron, OH does.
Why turnout in Downtown Akron looks the way it does
Renters vote less often than owners. About 90% of households in Downtown Akron rent, about 65 points above the U.S. average of 25%. Limited routine healthcare access lines up with lower turnout, and Downtown Akron sits in the bottom quarter on routine-care measures. High food insecurity lines up with lower turnout, and about 43% of adults in Downtown Akron report food insecurity, above 96% of neighborhoods. Learn more about the findings and methodology on the political spectrum map.
Nearby Neighborhoods
- University of Ohio Akron, Akron, OH D+49
- Summit Lake, Akron, OH D+50
- Lane-Wooster, Akron, OH D+78
- South Akron, Akron, OH D+39
- Middlebury, Akron, OH D+42
- Elizabeth Park Valley, Akron, OH D+46
- Highland Square, Akron, OH D+48
- West Akron, Akron, OH D+76
- East Akron, Akron, OH D+50
- Firestone Park, Akron, OH D+24
Neighborhoods with Similar Populations
- Nearnorthwest, South Bend, IN D+48
- Grant Beach, Springfield, MO Even
- Mills Estates, Burlingame, CA D+43
- Angells, Ann Arbor, MI D+69
- Dahlman, Omaha, NE D+38
- Sycamore Manor, Sycamore, IL D+14
- Hillwood Estates, Nashville, TN D+5
- South Side, Sandusky, OH D+20
- Arena District, San Antonio, TX D+44
- West Downtown Dearborn, Dearborn, MI D+8
Sources and methodology
Precinct-level voting records used to fit the model come from Ohio Secretary of State, Elections, distributed by the Voting and Election Science Team. Demographic inputs come from the U.S. Census Bureau (ACS 5-year estimates and the 2020 Decennial Census). Health and environmental inputs come from the CDC (PLACES and the Environmental Justice Index). Land cover comes from the USGS and EPA. Election-day and lead-up weather come from PRISM 4km daily grids and the NOAA Global Historical Climatology Network. Mail-voting and election-administration patterns come from the MIT Election Lab's Survey of the Performance of American Elections. Block-group crime detail comes from CrimeGrade. Internet data and modeling support provided by ISPreports.org.
Modeling and analysis by the BestNeighborhood data science team. Full methodology and findings: political spectrum map.
Methodology reviewed by the BestNeighborhood data team. Last updated May 2026.