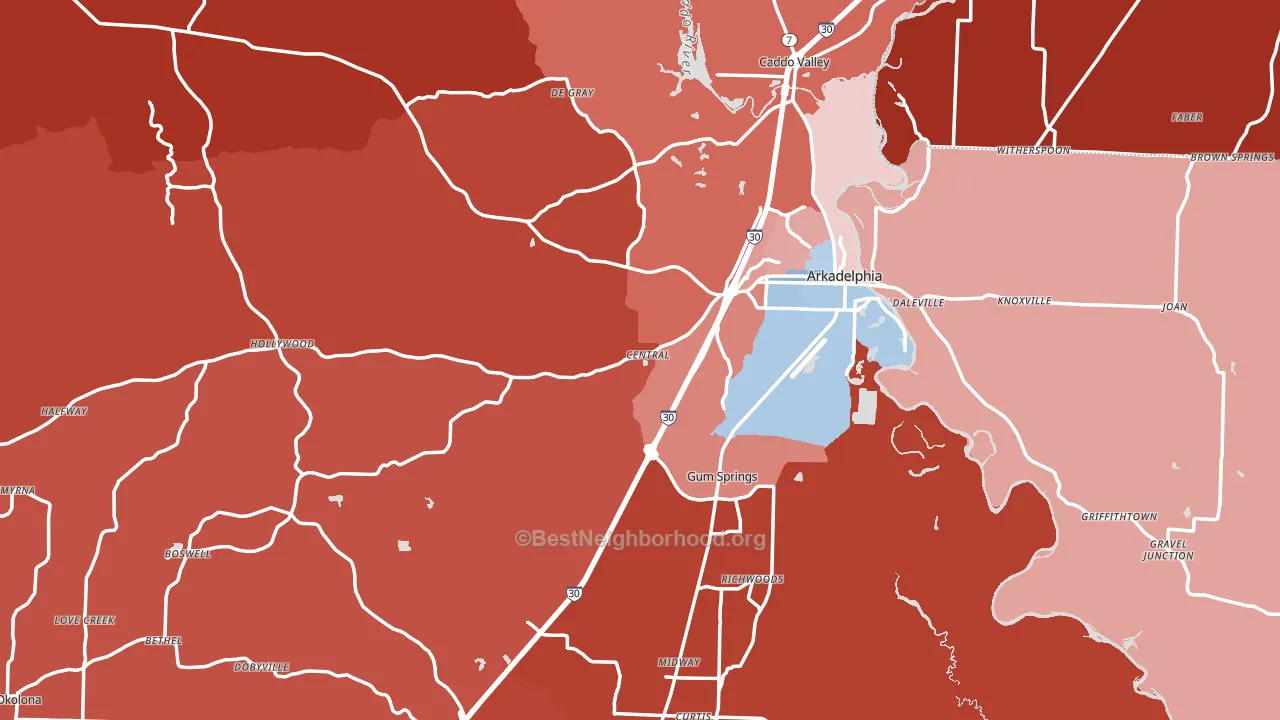
Clark County leans Republican by roughly 18 points: about 41% of voters vote Democratic and 59% Republican.
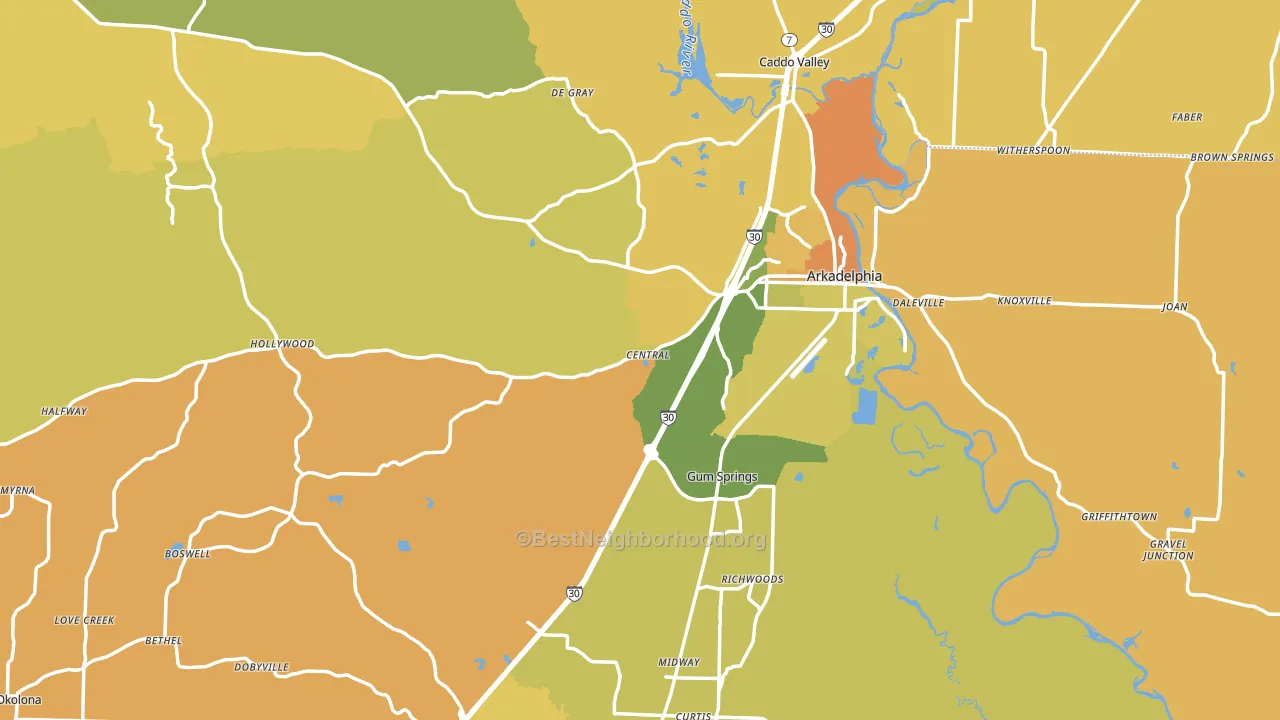
About 48% of adults in Clark County typically vote, below the U.S. average of about 62%. Among adults in Clark County, ~20% vote Democratic, ~28% Republican, and ~52% don't vote. The map below shows estimated turnout by block group.
How Clark County compares
Among counties within 50 miles, Clark County leans more Republican than 3 of 11 neighbors.
Clark County runs about 12 points more Democratic than Arkansas as a whole.
Politics vary noticeably by city within Clark County. The east side runs the most Democratic (D+10) and the northwest side runs the most Republican (R+67), a spread of about 78 points.
Why Clark County leans the way it does
Density, race composition, education, and family structure all sit close to their national averages in Clark County. The lean here lands roughly where demographic data alone would predict.
Renting and voter turnout
Places with renter-heavy households tend to turn out at a lower rate; Clark County, AR sits in the top tenth nationally on this measure.
Why turnout in Clark County looks the way it does
Renters vote less often than owners. About 38% of households in Clark County rent, about 13 points above the U.S. average of 25%. Learn more about the findings and methodology on the political spectrum map.
Nearby Counties
- Hot Spring County, AR R+51
- Garland County, AR R+33
- Nevada County, AR R+27
- Pike County, AR R+69
- Dallas County, AR R+18
- Hempstead County, AR R+18
- Ouachita County, AR R+14
- Montgomery County, AR R+67
- Grant County, AR R+71
- Howard County, AR R+33
Counties with Similar Populations
- Fayette County, IL R+59
- Coahoma County, MS D+51
- Wabasha County, MN R+30
- Texas County, OK R+45
- Wyoming County, WV R+73
- Jersey County, IL R+44
- Sevier County, UT R+70
- Logan County, CO R+50
- Moore County, TX R+32
- Hockley County, TX R+63
Sources and methodology
Precinct-level voting records used to fit the model come from Arkansas Secretary of State, Elections, distributed by the Voting and Election Science Team. Demographic inputs come from the U.S. Census Bureau (ACS 5-year estimates and the 2020 Decennial Census). Health and environmental inputs come from the CDC (PLACES and the Environmental Justice Index). Land cover comes from the USGS and EPA. Election-day and lead-up weather come from PRISM 4km daily grids and the NOAA Global Historical Climatology Network. Mail-voting and election-administration patterns come from the MIT Election Lab's Survey of the Performance of American Elections. Block-group crime detail comes from CrimeGrade. Internet data and modeling support provided by ISPreports.org.
Modeling and analysis by the BestNeighborhood data science team. Full methodology and findings: political spectrum map.
Methodology reviewed by the BestNeighborhood data team. Last updated May 2026.