Contra Costa County leans heavily Democratic by roughly 36 points: about 68% of voters vote Democratic and 32% Republican.
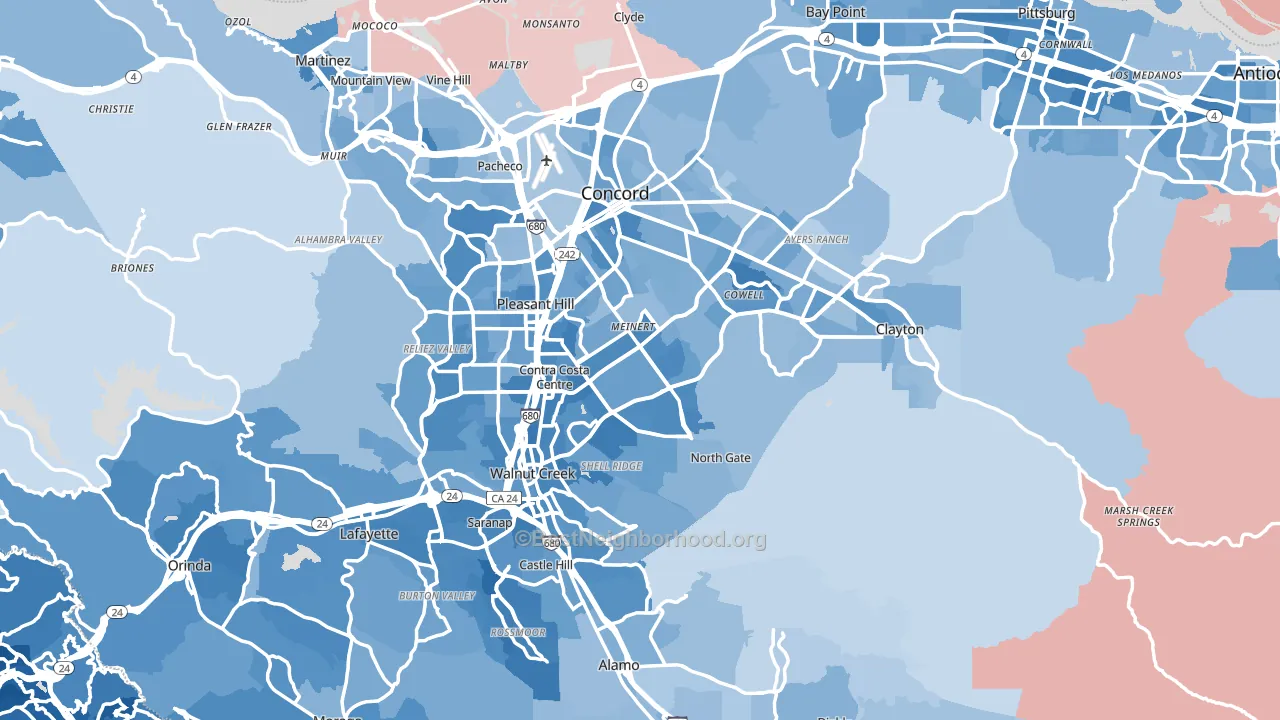
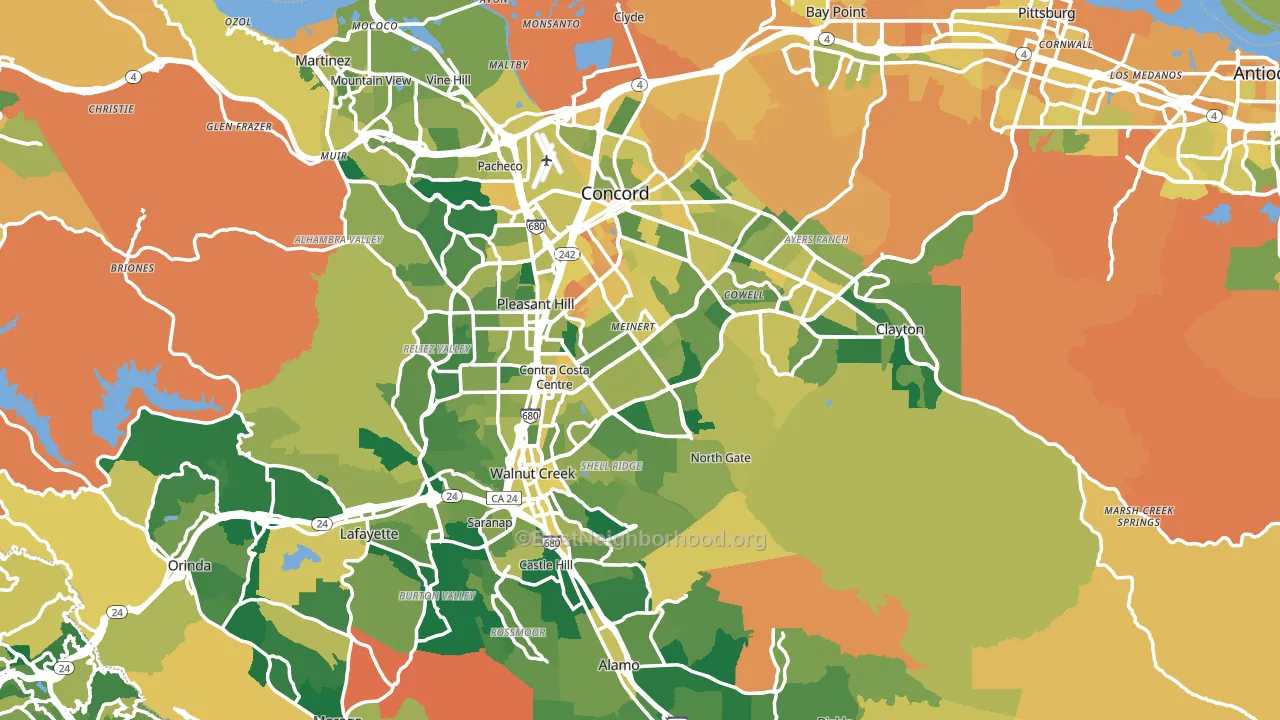
About 60% of adults in Contra Costa County typically vote, near the U.S. average of about 62%. Among adults in Contra Costa County, ~41% vote Democratic, ~19% Republican, and ~40% don't vote. The map below shows estimated turnout by block group.
How Contra Costa County compares
Among counties within 50 miles, Contra Costa County leans more Democratic than 5 of 9 neighbors.
Contra Costa County runs about 16 points more Democratic than California as a whole.
Politics vary noticeably by city within Contra Costa County. The southwest side is the most Democratic-leaning (D+61) and the east side is the least Democratic-leaning (D+18), a spread of about 43 points.
Why Contra Costa County leans the way it does
This analysis examined 14,881 data points per county to find what predicts political lean and turnout. The items below are a few correlations that stood out for Contra Costa County, not a ranked or complete list of what matters most.
Dense areas vote Democratic. About 84% of residents in Contra Costa County live in densely developed areas, about 47 points above the U.S. average of 36%. High college attainment predicts Democratic voting, and Contra Costa County sits in the top quarter (about 45%, above 95% of counties). A high never-married share predicts Democratic voting, and about 33% of adults in Contra Costa County have never been married, above 76% of counties.
Paved land cover and Democratic lean
Places with extensive paved surfaces tend to lean Democratic; Contra Costa County, CA sits in the top tenth nationally on this measure. Paved ground does not change how people vote; it mostly reflects how urban and built-up a place is.
Why turnout in Contra Costa County looks the way it does
Crowded housing lines up with lower turnout. About 6% of homes in Contra Costa County have more than one occupant per room, above 94% of counties. Strong routine healthcare access lines up with higher turnout, and Contra Costa County sits in the top quarter on routine-care measures. Learn more about the findings and methodology on the political spectrum map.
Nearby Counties
- Alameda County, CA D+49
- Solano County, CA D+21
- San Francisco County, CA D+61
- Marin County, CA D+48
- San Mateo County, CA D+48
- Napa County, CA D+32
- San Joaquin County, CA D+4
- Santa Clara County, CA D+32
- Yolo County, CA D+35
- Sonoma County, CA D+42
Counties with Similar Populations
- Fairfax County, VA D+37
- Salt Lake County, UT D+10
- Wake County, NC D+28
- Mecklenburg County, NC D+35
- Allegheny County, PA D+22
- Cuyahoga County, OH D+35
- Fulton County, GA D+46
- Collin County, TX R+6
- Montgomery County, MD D+52
- Oakland County, MI D+14
Sources and methodology
Precinct-level voting records used to fit the model come from California Secretary of State, Elections, distributed by the Voting and Election Science Team. Demographic inputs come from the U.S. Census Bureau (ACS 5-year estimates and the 2020 Decennial Census). Health and environmental inputs come from the CDC (PLACES and the Environmental Justice Index). Land cover comes from the USGS and EPA. Election-day and lead-up weather come from PRISM 4km daily grids and the NOAA Global Historical Climatology Network. Mail-voting and election-administration patterns come from the MIT Election Lab's Survey of the Performance of American Elections. Block-group crime detail comes from CrimeGrade. Internet data and modeling support provided by ISPreports.org.
Modeling and analysis by the BestNeighborhood data science team. Full methodology and findings: political spectrum map.
Methodology reviewed by the BestNeighborhood data team. Last updated May 2026.