Collin County leans slightly Republican by roughly 6 points: about 47% of voters vote Democratic and 53% Republican.
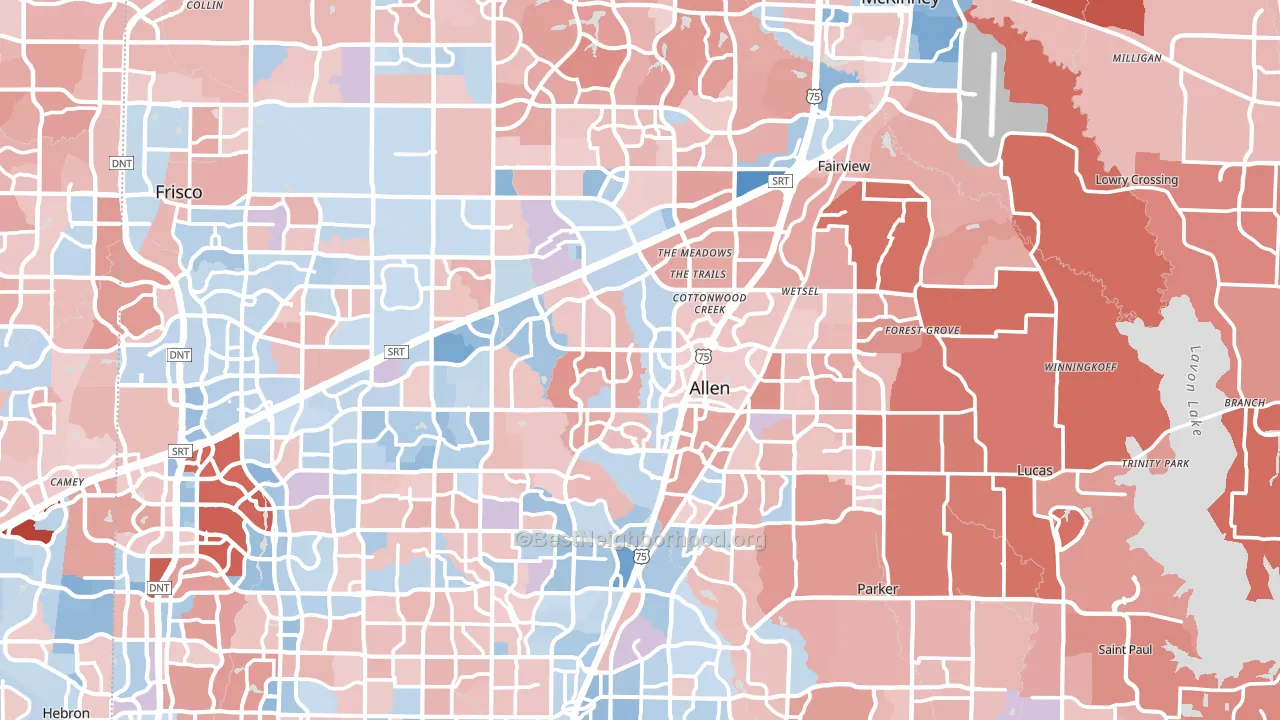
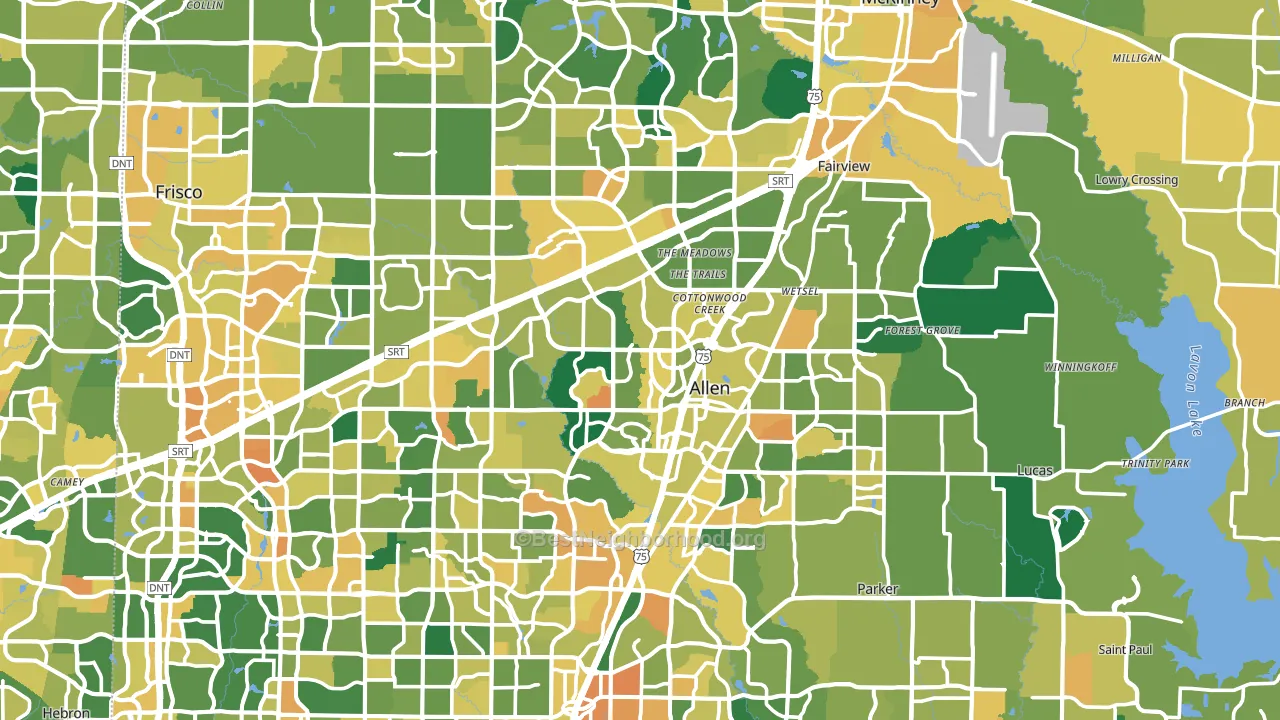
About 65% of adults in Collin County typically vote, near the U.S. average of about 62%. Among adults in Collin County, ~30% vote Democratic, ~34% Republican, and ~36% don't vote. The map below shows estimated turnout by block group.
How Collin County compares
Among counties within 50 miles, Collin County leans more Republican than 2 of 10 neighbors.
Collin County runs about 8 points more Democratic than Texas as a whole.
Politics vary noticeably by city within Collin County. The south side runs the most Democratic (D+7) and the east side runs the most Republican (R+26), a spread of about 33 points.
Why Collin County leans the way it does
This analysis examined 14,881 data points per county to find what predicts political lean and turnout. The items below are a few correlations that stood out for Collin County, not a ranked or complete list of what matters most.
Collin County votes Republican even though it is densely developed (about 83%, far above the Texas average of 35%). State and regional patterns outweigh the Democratic lean that density usually predicts here. A high family-household share predicts Republican voting, and about 76% of households in Collin County are family households, above 96% of counties.
Population density and Democratic lean
Places with high population density tend to lean Democratic; Collin County, TX sits in the top tenth nationally on this measure.
Why turnout in Collin County looks the way it does
Areas with high high-school completion turn out at higher rates. About 95% of adults in Collin County have completed high school, about 9 points above the Texas average of 86%. Learn more about the findings and methodology on the political spectrum map.
Nearby Counties
- Denton County, TX R+7
- Rockwall County, TX R+35
- Dallas County, TX D+27
- Hunt County, TX R+49
- Kaufman County, TX R+29
- Grayson County, TX R+43
- Tarrant County, TX D+3
- Fannin County, TX R+58
- Cooke County, TX R+57
- Ellis County, TX R+31
Counties with Similar Populations
- Fulton County, GA D+46
- Montgomery County, MD D+52
- Pima County, AZ D+16
- Honolulu County, HI D+18
- Mecklenburg County, NC D+35
- Fresno County, CA D+3
- Westchester County, NY D+27
- St. Louis County, MO D+28
- Wake County, NC D+28
- Duval County, FL D+7
Sources and methodology
Precinct-level voting records used to fit the model come from Texas Secretary of State, Elections Division, distributed by the Voting and Election Science Team. Demographic inputs come from the U.S. Census Bureau (ACS 5-year estimates and the 2020 Decennial Census). Health and environmental inputs come from the CDC (PLACES and the Environmental Justice Index). Land cover comes from the USGS and EPA. Election-day and lead-up weather come from PRISM 4km daily grids and the NOAA Global Historical Climatology Network. Mail-voting and election-administration patterns come from the MIT Election Lab's Survey of the Performance of American Elections. Block-group crime detail comes from CrimeGrade. Internet data and modeling support provided by ISPreports.org.
Modeling and analysis by the BestNeighborhood data science team. Full methodology and findings: political spectrum map.
Methodology reviewed by the BestNeighborhood data team. Last updated May 2026.