Davenport is a Democratic stronghold. About 76% of voters here vote Democratic and 24% Republican.
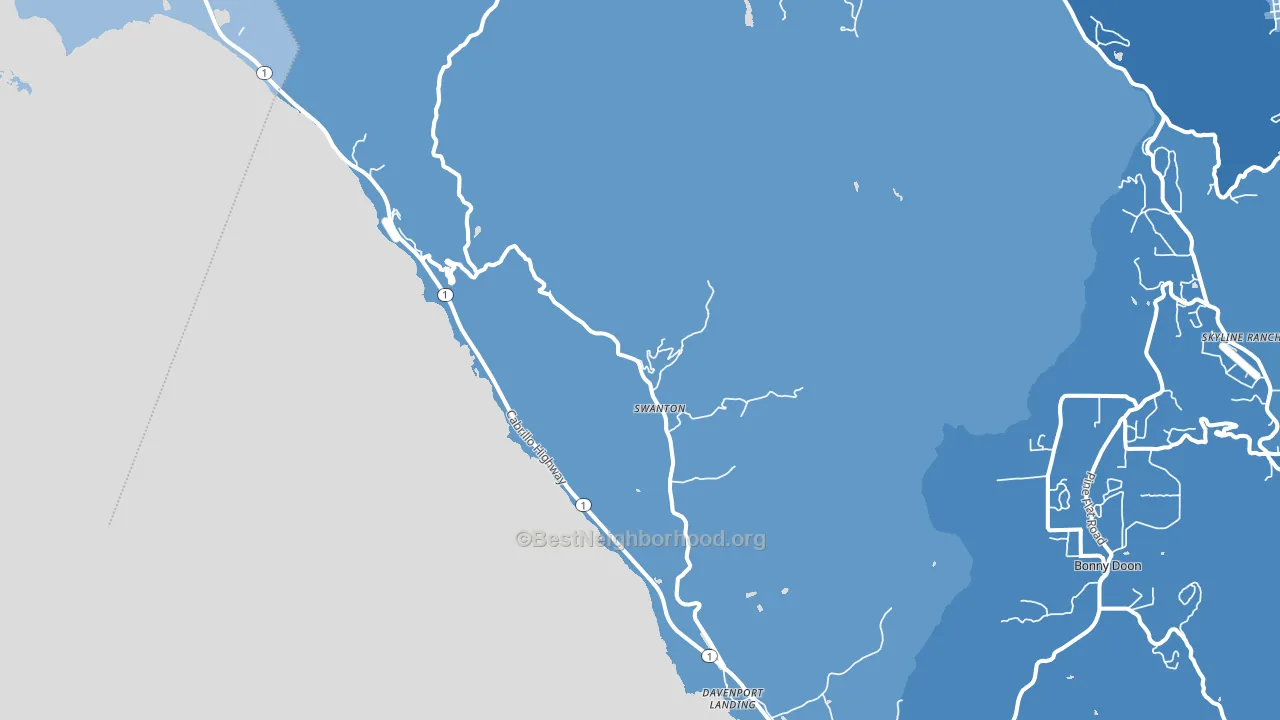
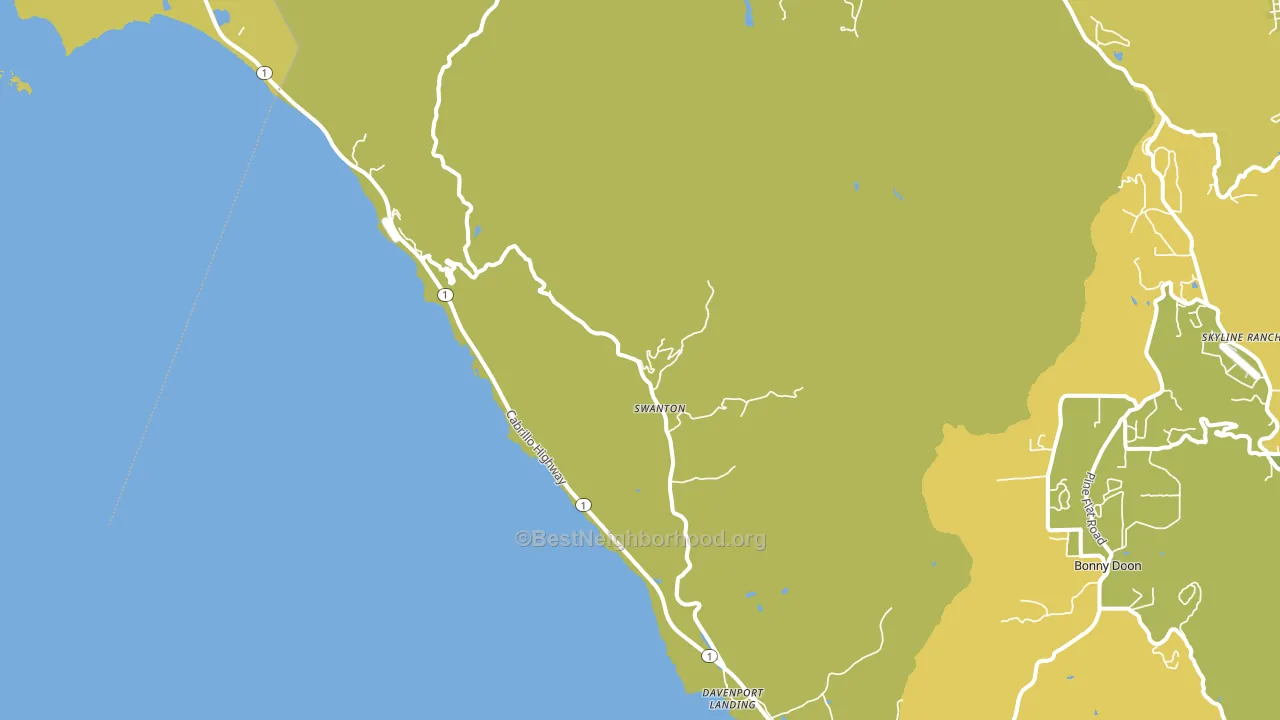
About 57% of adults in Davenport typically vote, near the U.S. average of about 62%. Among adults in Davenport, ~43% vote Democratic, ~14% Republican, and ~43% don't vote. The map below shows estimated turnout by block group.
How Davenport compares
Among cities within 25 miles, Davenport leans more Democratic than 28 of 35 neighbors.
Davenport runs about 32 points more Democratic than California as a whole.
Why Davenport leans the way it does
This analysis examined 14,881 data points per city to find what predicts political lean and turnout. The items below are a few correlations that stood out for Davenport, not a ranked or complete list of what matters most.
Areas with high college attainment vote Democratic. About 40% of adults in Davenport hold a bachelor's degree, about 12 points above the U.S. average of 28%. A high never-married share predicts Democratic voting, and about 42% of adults in Davenport have never been married, above 95% of cities.
Walkability and Democratic lean
Places with a highly walkable street grid tend to lean Democratic; Davenport, CA sits in the top quarter nationally on this measure. A walkable street grid does not change how people vote; it mostly reflects how urban a place is.
Why turnout in Davenport looks the way it does
Renters vote less often than owners. About 43% of households in Davenport rent, about 18 points above the U.S. average of 25%. Crowded housing lines up with lower turnout, and about 7% of homes in Davenport have more than one occupant per room, above 93% of cities. Learn more about the findings and methodology on the political spectrum map.
Nearby Cities
- Swanton, CA D+54
- Forest Springs, CA D+41
- Brookdale, CA D+36
- Boulder Creek, CA D+37
- Ben Lomond, CA D+31
- Felton, CA D+39
- San Lorenzo Park, CA D+47
- Mount Hermon, CA D+46
- Lompico, CA D+30
- Scotts Valley, CA D+42
Cities with Similar Populations
- Sultana, CA R+17
- Guysie, GA R+78
- Whiteman Air Force Base, MO R+51
- Goshen, NH R+28
- Darling, MN R+52
- Pineview, TX R+75
- Silver Lake, OR R+65
- Riverside, SC R+26
- Ottokee, OH R+55
- Shady Grove, TX R+72
Sources and methodology
Precinct-level voting records used to fit the model come from California Secretary of State, Elections, distributed by the Voting and Election Science Team. Demographic inputs come from the U.S. Census Bureau (ACS 5-year estimates and the 2020 Decennial Census). Health and environmental inputs come from the CDC (PLACES and the Environmental Justice Index). Land cover comes from the USGS and EPA. Election-day and lead-up weather come from PRISM 4km daily grids and the NOAA Global Historical Climatology Network. Mail-voting and election-administration patterns come from the MIT Election Lab's Survey of the Performance of American Elections. Block-group crime detail comes from CrimeGrade. Internet data and modeling support provided by ISPreports.org.
Modeling and analysis by the BestNeighborhood data science team. Full methodology and findings: political spectrum map.
Methodology reviewed by the BestNeighborhood data team. Last updated May 2026.