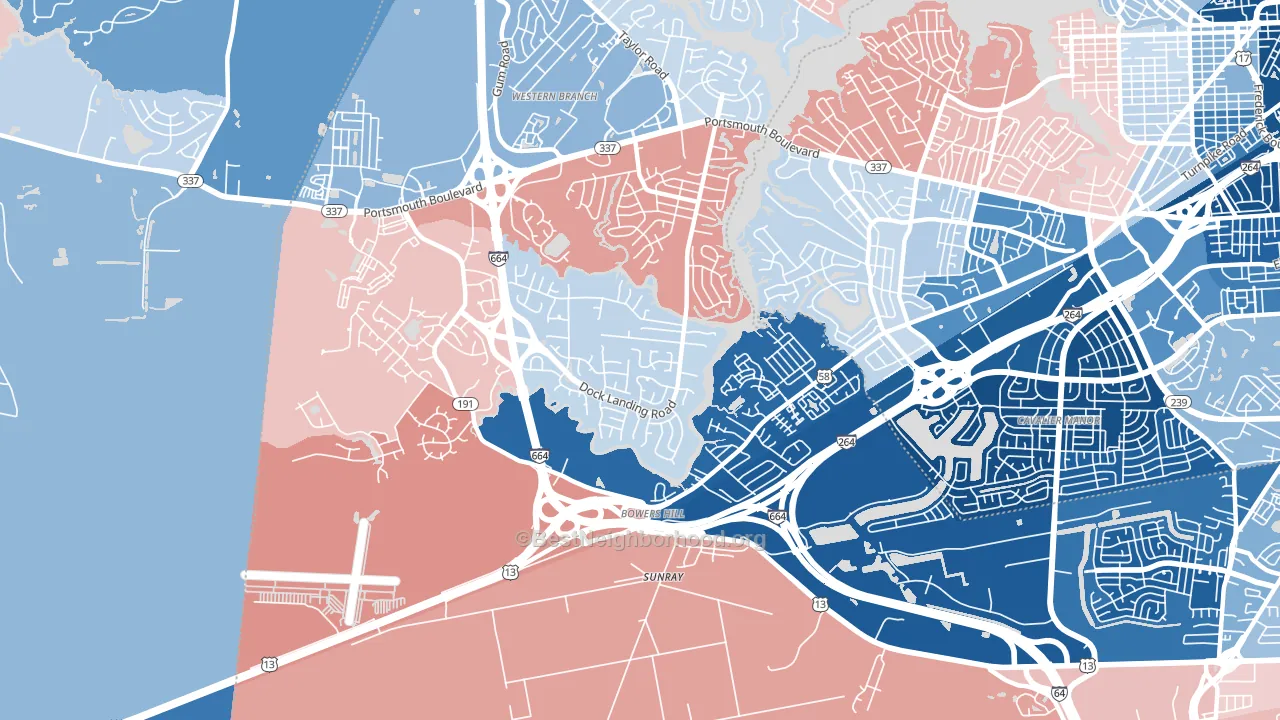
Western Branch South leans Democratic by roughly 18 points: about 59% of voters vote Democratic and 41% Republican.
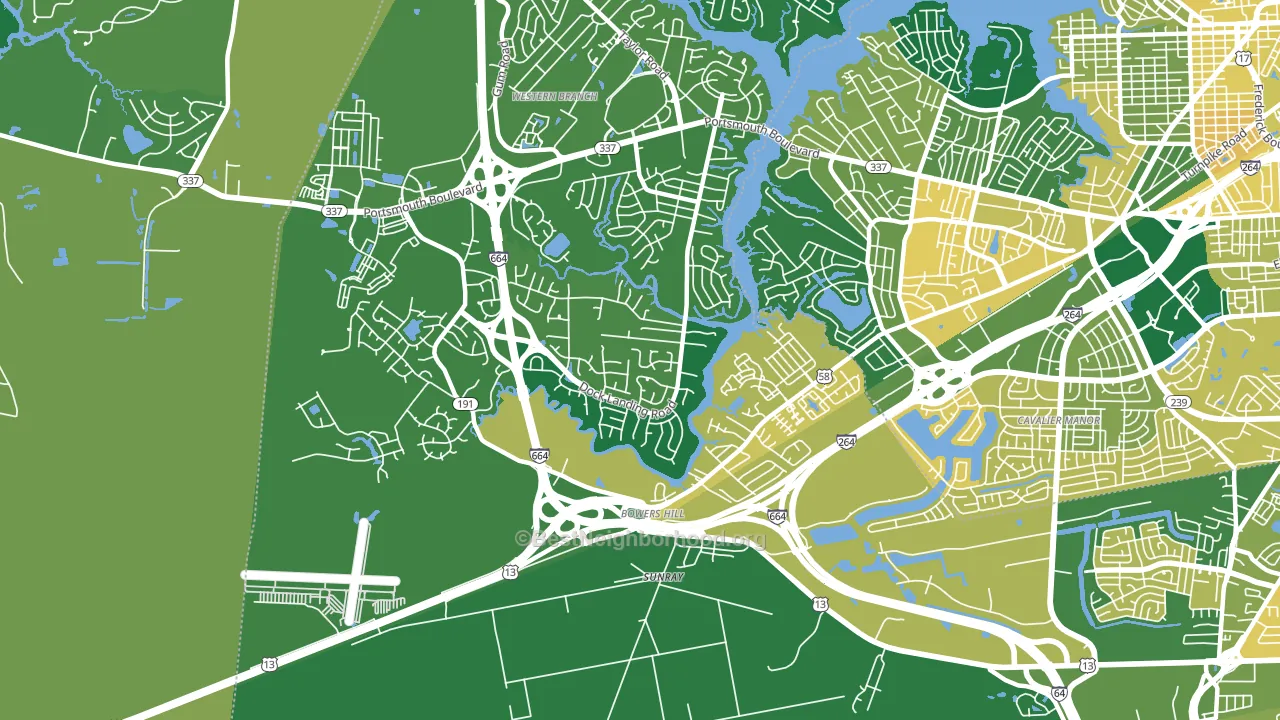
About 84% of adults in Western Branch South typically vote, above the U.S. average of about 62%. Among adults in Western Branch South, ~49% vote Democratic, ~34% Republican, and ~17% don't vote. The map below shows estimated turnout by block group.
How Western Branch South compares
Western Branch South sits in a sparsely populated area with few comparable neighborhoods nearby.
Western Branch South runs about 12 points more Democratic than Virginia as a whole.
Politics vary noticeably by block within Western Branch South. The southeast side runs the most Democratic (D+72) and the northeast side runs the most Republican (R+22), a spread of about 95 points.
Why Western Branch South leans the way it does
Density, race composition, education, and family structure all sit close to their national averages in Western Branch South. The lean here lands roughly where demographic data alone would predict.
Preventive-care access and voter turnout
Places with strong routine preventive-care access tend to turn out at a higher rate; Western Branch South, Chesapeake, VA sits above the national average on this measure. Dental visits do not drive turnout; the rate reflects income, insurance, and healthcare access, which line up with who votes.
Why turnout in Western Branch South looks the way it does
Homeowners vote more often than renters. About 86% of households in Western Branch South own their home, about 10 points above the Virginia average of 76%. Learn more about the findings and methodology on the political spectrum map.
Nearby Neighborhoods
- Western Branch North, Chesapeake, VA D+17
- Deep Creek North, Chesapeake, VA D+18
- Deep Creek West, Chesapeake, VA D+5
- Deep Creek South, Chesapeake, VA D+4
- Downtown Norfolk, Norfolk, VA D+61
- Ghent, Norfolk, VA D+49
- South Norfolk, Chesapeake, VA D+38
- Ghent Square, Norfolk, VA D+39
- Lamberts Point, Norfolk, VA D+67
- Highland Park, Norfolk, VA D+73
Neighborhoods with Similar Populations
- Rose Garden, San Jose, CA D+46
- Central Omaha, Omaha, NE D+24
- Back Creek Church Road, Charlotte, NC D+62
- Mariposa, Glendale, CA D+9
- Sunrise Golf Village East, Sunrise, FL D+52
- Joaquin, Provo, UT R+9
- Pleasant Valley, Portland, OR D+21
- La Sierra South, Riverside, CA Even
- Grove Park, Atlanta, GA D+85
- Alamo Placita, Denver, CO D+64
Sources and methodology
Precinct-level voting records used to fit the model come from Virginia Department of Elections, distributed by the Voting and Election Science Team. Demographic inputs come from the U.S. Census Bureau (ACS 5-year estimates and the 2020 Decennial Census). Health and environmental inputs come from the CDC (PLACES and the Environmental Justice Index). Land cover comes from the USGS and EPA. Election-day and lead-up weather come from PRISM 4km daily grids and the NOAA Global Historical Climatology Network. Mail-voting and election-administration patterns come from the MIT Election Lab's Survey of the Performance of American Elections. Block-group crime detail comes from CrimeGrade. Internet data and modeling support provided by ISPreports.org.
Modeling and analysis by the BestNeighborhood data science team. Full methodology and findings: political spectrum map.
Methodology reviewed by the BestNeighborhood data team. Last updated May 2026.