Delmar Parkway leans heavily Democratic by roughly 32 points: about 66% of voters vote Democratic and 34% Republican.
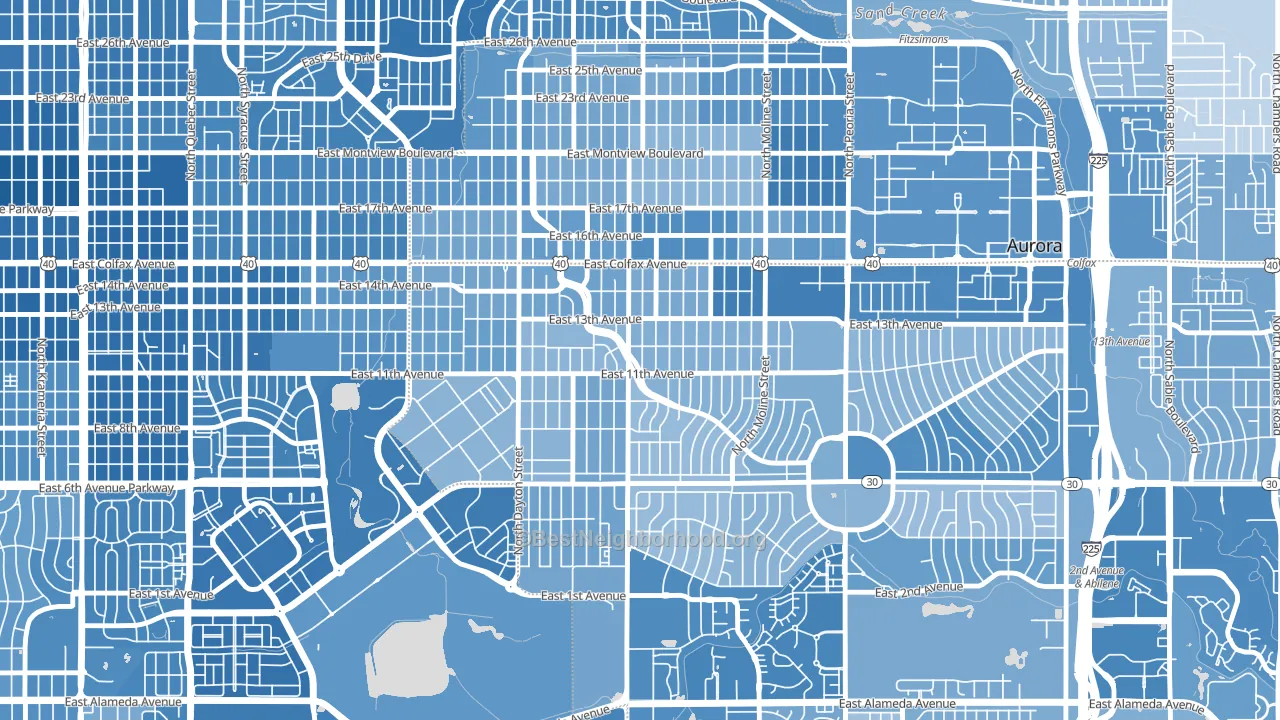
About 39% of adults in Delmar Parkway typically vote, below the U.S. average of about 62%. Among adults in Delmar Parkway, ~26% vote Democratic, ~13% Republican, and ~61% don't vote. The map below shows estimated turnout by block group.
How Delmar Parkway compares
Among neighborhoods within 5 miles, Delmar Parkway leans more Democratic than 7 of 32 neighbors.
Delmar Parkway runs about 21 points more Democratic than Colorado as a whole.
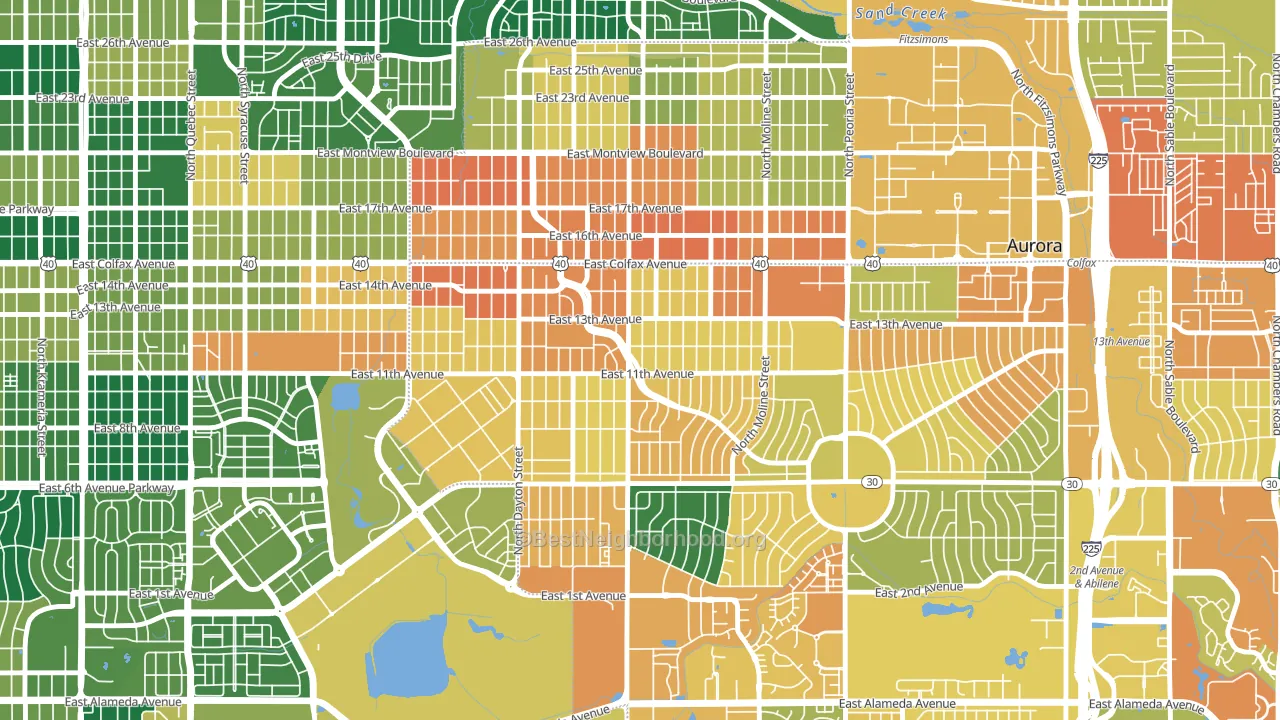
Politics vary noticeably by block within Delmar Parkway. The northeast side is the most Democratic-leaning (D+47) and the east side is the least Democratic-leaning (D+25), a spread of about 22 points.
Why Delmar Parkway leans the way it does
This analysis examined 14,881 data points per neighborhood to find what predicts political lean and turnout. The items below are a few correlations that stood out for Delmar Parkway, not a ranked or complete list of what matters most.
Dense areas vote Democratic. More than 99% of residents in Delmar Parkway live in densely developed areas, about 64 points above the U.S. average of 36%.
Population density and Democratic lean
Places with high population density tend to lean Democratic; Delmar Parkway, Aurora, CO sits in the top quarter nationally on this measure.
Why turnout in Delmar Parkway looks the way it does
Areas with limited routine healthcare access turn out at lower rates. Delmar Parkway is in the bottom quarter nationally for routine-care measures such as insurance coverage, preventive screenings, and dental visits. The dental-visit rate here is about 47%, about 16 points below the Colorado average of 63%. Low high-school completion lines up with lower turnout, and about 71% of adults in Delmar Parkway have completed high school, below 94% of neighborhoods. Learn more about the findings and methodology on the political spectrum map.
Nearby Neighborhoods
- North Aurora, Aurora, CO D+39
- Highland Park, Aurora, CO D+36
- Highline Villages, Aurora, CO D+45
- Jewell Heights-Hoffman Heights, Aurora, CO D+37
- Lynn Knoll, Aurora, CO D+30
- Expo Park, Aurora, CO D+33
- Morris Heights, Aurora, CO D+35
- Aurora Hills, Aurora, CO D+27
- Chambers Heights, Aurora, CO D+28
- Sable Altura Chambers, Aurora, CO D+24
Neighborhoods with Similar Populations
- Desert Hills, Cave Creek, AZ R+23
- Widefield, Security-Widefield, CO R+8
- Citizens Southwest, Jackson, MS D+77
- Lanham-Seabrook, Lanham, MD D+67
- Morningside Park, Inglewood, CA D+75
- Kenmore, Akron, OH D+10
- Southridge Village, Fontana, CA D+17
- West Side, St. Paul, MN D+46
- Bixby Area, Long Beach, CA D+37
- Old Fourth Ward, Atlanta, GA D+59
Sources and methodology
Precinct-level voting records used to fit the model come from Colorado Secretary of State, Elections, distributed by the Voting and Election Science Team. Demographic inputs come from the U.S. Census Bureau (ACS 5-year estimates and the 2020 Decennial Census). Health and environmental inputs come from the CDC (PLACES and the Environmental Justice Index). Land cover comes from the USGS and EPA. Election-day and lead-up weather come from PRISM 4km daily grids and the NOAA Global Historical Climatology Network. Mail-voting and election-administration patterns come from the MIT Election Lab's Survey of the Performance of American Elections. Block-group crime detail comes from CrimeGrade. Internet data and modeling support provided by ISPreports.org.
Modeling and analysis by the BestNeighborhood data science team. Full methodology and findings: political spectrum map.
Methodology reviewed by the BestNeighborhood data team. Last updated May 2026.