North Aurora leans heavily Democratic by roughly 38 points: about 69% of voters vote Democratic and 31% Republican.
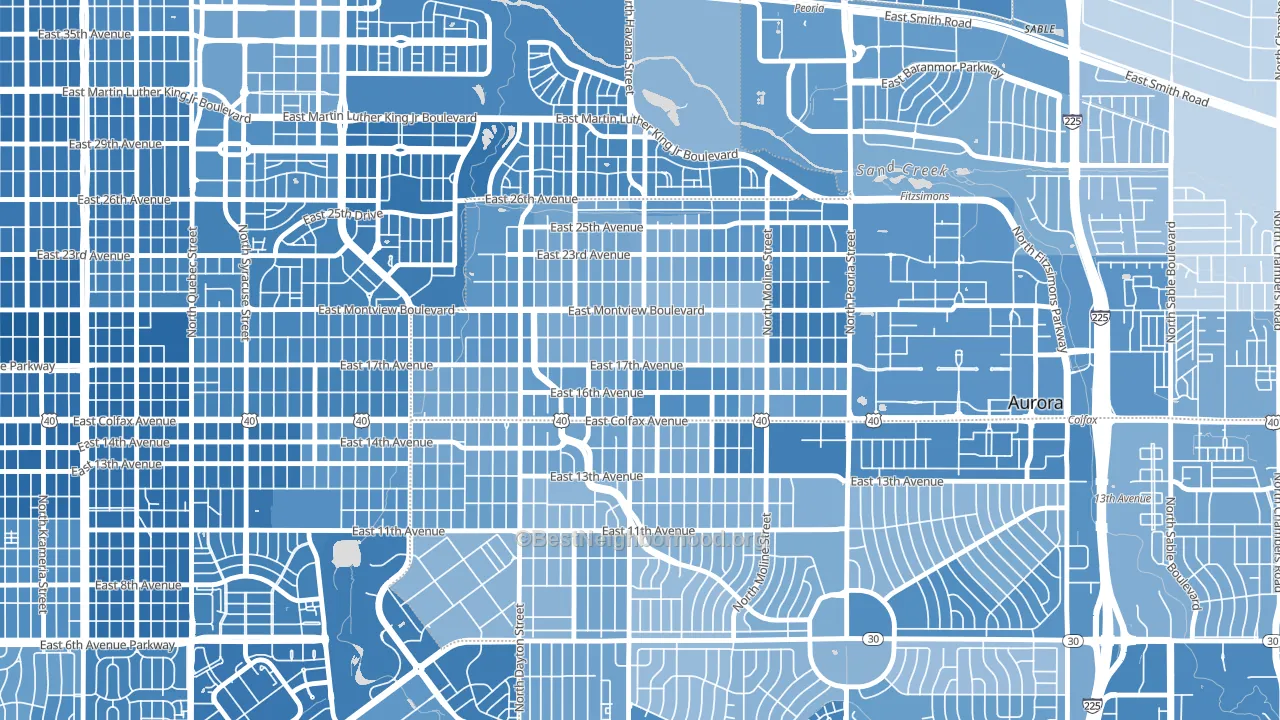
About 32% of adults in North Aurora typically vote, below the U.S. average of about 62%. Among adults in North Aurora, ~22% vote Democratic, ~10% Republican, and ~68% don't vote. The map below shows estimated turnout by block group.
How North Aurora compares
Among neighborhoods within 5 miles, North Aurora leans more Democratic than 16 of 28 neighbors.
North Aurora runs about 28 points more Democratic than Colorado as a whole.
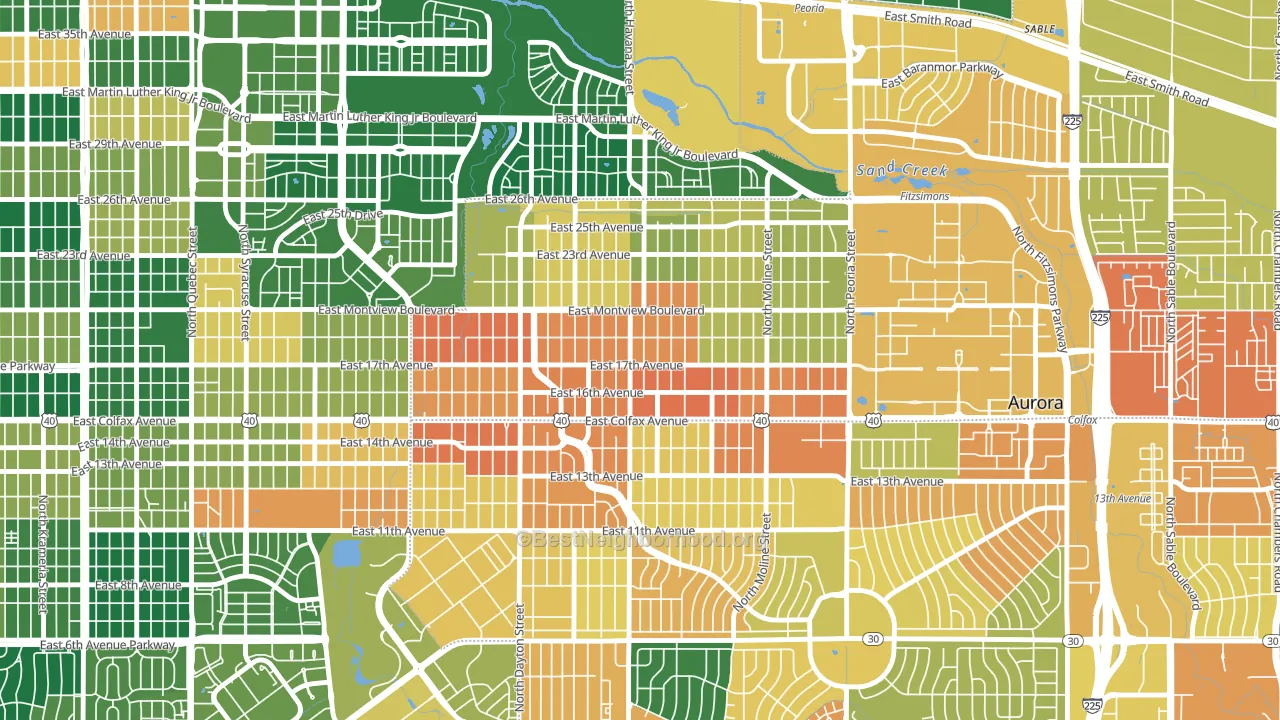
Politics vary noticeably by block within North Aurora. The northeast side is the most Democratic-leaning (D+51) and the southeast side is the least Democratic-leaning (D+29), a spread of about 23 points.
Why North Aurora leans the way it does
This analysis examined 14,881 data points per neighborhood to find what predicts political lean and turnout. The items below are a few correlations that stood out for North Aurora, not a ranked or complete list of what matters most.
Density combined with diversity predicts Democratic voting. Non-Hispanic white share in North Aurora is about 17%, about 56 points below the U.S. average of 72%. A high never-married share predicts Democratic voting, and about 46% of adults in North Aurora have never been married, above 76% of neighborhoods.
Cancer-screening access and voter turnout
Places with low colon-cancer-screening access tend to turn out at a lower rate; North Aurora, Aurora, CO sits in the bottom tenth nationally on this measure. Cancer screening does not drive turnout; it reflects income, insurance, and healthcare access.
Why turnout in North Aurora looks the way it does
Areas with limited routine healthcare access turn out at lower rates. North Aurora is in the bottom quarter nationally for routine-care measures such as insurance coverage, preventive screenings, and dental visits. The dental-visit rate here is about 44%, about 20 points below the Colorado average of 63%. Renters vote less often than owners, and about 73% of households in North Aurora rent, compared to around 45% in nearby neighborhoods. High-crime urban areas turn out at lower rates, and North Aurora sits in the top 15% on a violent-crime measure. Learn more about the findings and methodology on the political spectrum map.
Nearby Neighborhoods
- Delmar Parkway, Aurora, CO D+32
- Highland Park, Aurora, CO D+36
- Jewell Heights-Hoffman Heights, Aurora, CO D+37
- Morris Heights, Aurora, CO D+35
- Stapleton, Denver, CO D+56
- Highline Villages, Aurora, CO D+45
- Lynn Knoll, Aurora, CO D+30
- Sable Altura Chambers, Aurora, CO D+24
- Chambers Heights, Aurora, CO D+28
- Expo Park, Aurora, CO D+33
Neighborhoods with Similar Populations
- Victory Hills, Kansas City, KS D+38
- Lakeview Terrace, Sylmar, CA D+18
- Dutchtown, St. Louis, MO D+64
- Squirrel Hill South, Pittsburgh, PA D+61
- Bluffview, Dallas, TX D+11
- Harrowgate, Philadelphia, PA D+53
- O'Hare, Chicago, IL R+8
- Logan Circle, Washington, DC D+77
- West Meadows, Tampa, FL D+15
- Rocky-Fork Blacklick Accord, Westerville, OH D+18
Sources and methodology
Precinct-level voting records used to fit the model come from Colorado Secretary of State, Elections, distributed by the Voting and Election Science Team. Demographic inputs come from the U.S. Census Bureau (ACS 5-year estimates and the 2020 Decennial Census). Health and environmental inputs come from the CDC (PLACES and the Environmental Justice Index). Land cover comes from the USGS and EPA. Election-day and lead-up weather come from PRISM 4km daily grids and the NOAA Global Historical Climatology Network. Mail-voting and election-administration patterns come from the MIT Election Lab's Survey of the Performance of American Elections. Block-group crime detail comes from CrimeGrade. Internet data and modeling support provided by ISPreports.org.
Modeling and analysis by the BestNeighborhood data science team. Full methodology and findings: political spectrum map.
Methodology reviewed by the BestNeighborhood data team. Last updated May 2026.