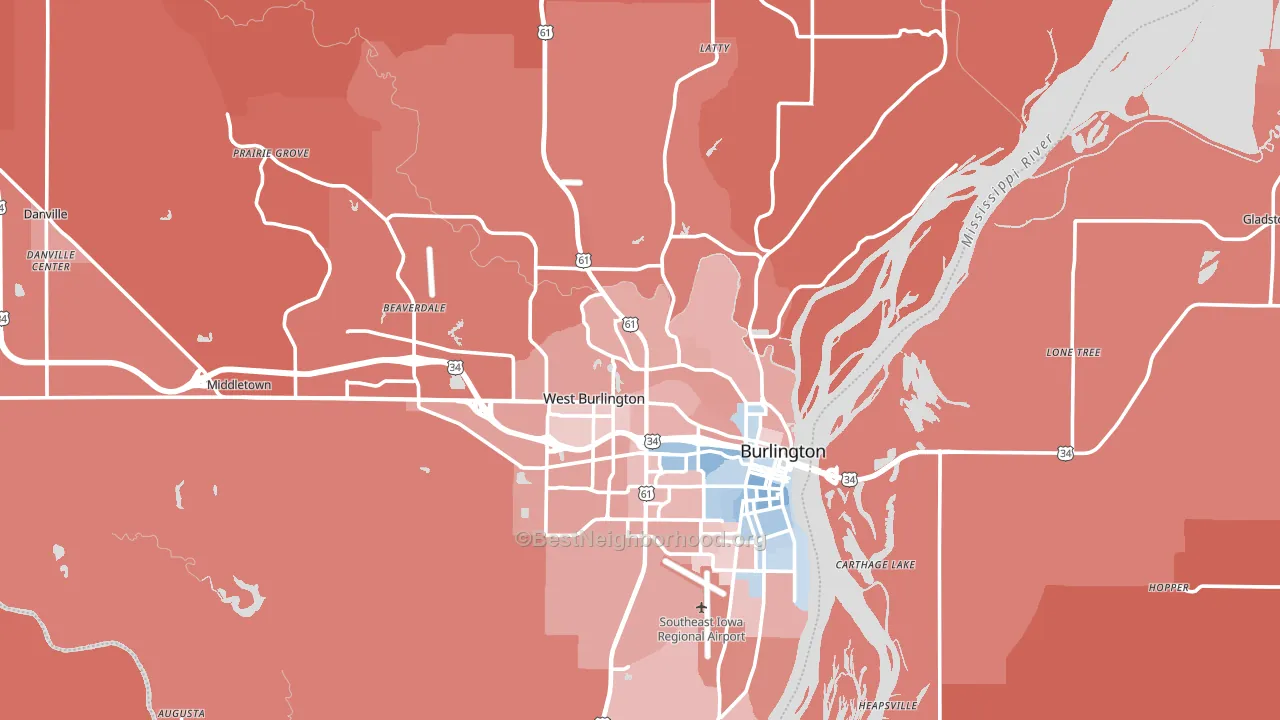
Des Moines County leans slightly Republican by roughly 8 points: about 46% of voters vote Democratic and 54% Republican.
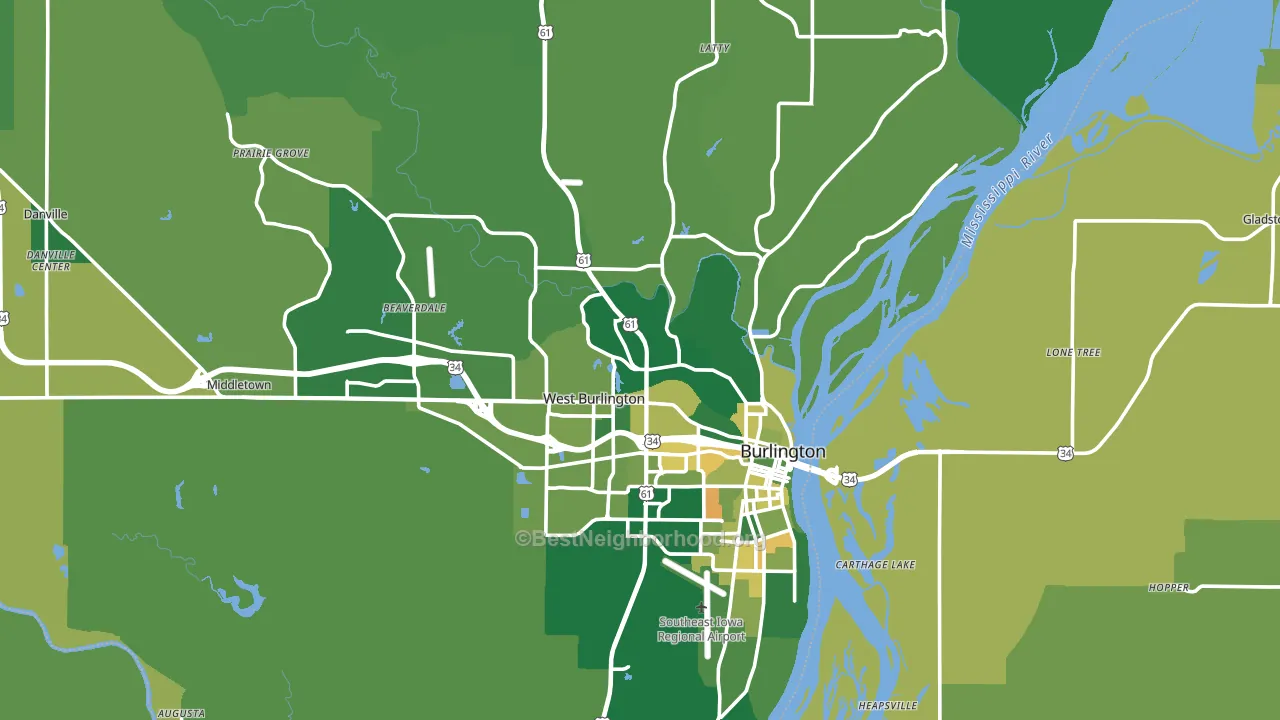
About 80% of adults in Des Moines County typically vote, above the U.S. average of about 62%. Among adults in Des Moines County, ~37% vote Democratic, ~43% Republican, and ~20% don't vote. The map below shows estimated turnout by block group.
How Des Moines County compares
Among counties within 50 miles, Des Moines County leans more Republican than 1 of 14 neighbors.
Des Moines County runs about 5 points more Democratic than Iowa as a whole.
Politics vary noticeably by city within Des Moines County. The southeast side runs the most Democratic (D+9) and the northeast side runs the most Republican (R+40), a spread of about 49 points.
Why Des Moines County leans the way it does
This analysis examined 14,881 data points per county to find what predicts political lean and turnout. The items below are a few correlations that stood out for Des Moines County, not a ranked or complete list of what matters most.
Car-dependent areas vote Republican. About 83% of residents in Des Moines County drive to work alone, about 10 points above the U.S. average of 74%.
High-school completion, uninsured rate, and voter turnout
Places that combine high-school-completion-heavy adults and a low uninsured rate tend to turn out at a higher rate, as Des Moines County, IA does.
Why turnout in Des Moines County looks the way it does
Areas with high high-school completion turn out at higher rates. About 94% of adults in Des Moines County have completed high school, above 84% of counties. Learn more about the findings and methodology on the political spectrum map.
Nearby Counties
- Henderson County, IL R+41
- Henry County, IA R+31
- Lee County, IA R+27
- Warren County, IL R+22
- Louisa County, IA R+37
- Hancock County, IL R+45
- Mercer County, IL R+33
- McDonough County, IL R+11
- Clark County, MO R+60
- Van Buren County, IA R+55
Counties with Similar Populations
- Jim Wells County, TX R+14
- Oconto County, WI R+40
- Crawford County, KS R+28
- Wayne County, WV R+55
- Douglas County, MN R+36
- Mayes County, OK R+56
- Union County, AR R+20
- Webster County, MO R+64
- Person County, NC R+24
- Champaign County, OH R+51
Sources and methodology
Precinct-level voting records used to fit the model come from Iowa Secretary of State, Elections, distributed by the Voting and Election Science Team. Demographic inputs come from the U.S. Census Bureau (ACS 5-year estimates and the 2020 Decennial Census). Health and environmental inputs come from the CDC (PLACES and the Environmental Justice Index). Land cover comes from the USGS and EPA. Election-day and lead-up weather come from PRISM 4km daily grids and the NOAA Global Historical Climatology Network. Mail-voting and election-administration patterns come from the MIT Election Lab's Survey of the Performance of American Elections. Block-group crime detail comes from CrimeGrade. Internet data and modeling support provided by ISPreports.org.
Modeling and analysis by the BestNeighborhood data science team. Full methodology and findings: political spectrum map.
Methodology reviewed by the BestNeighborhood data team. Last updated May 2026.