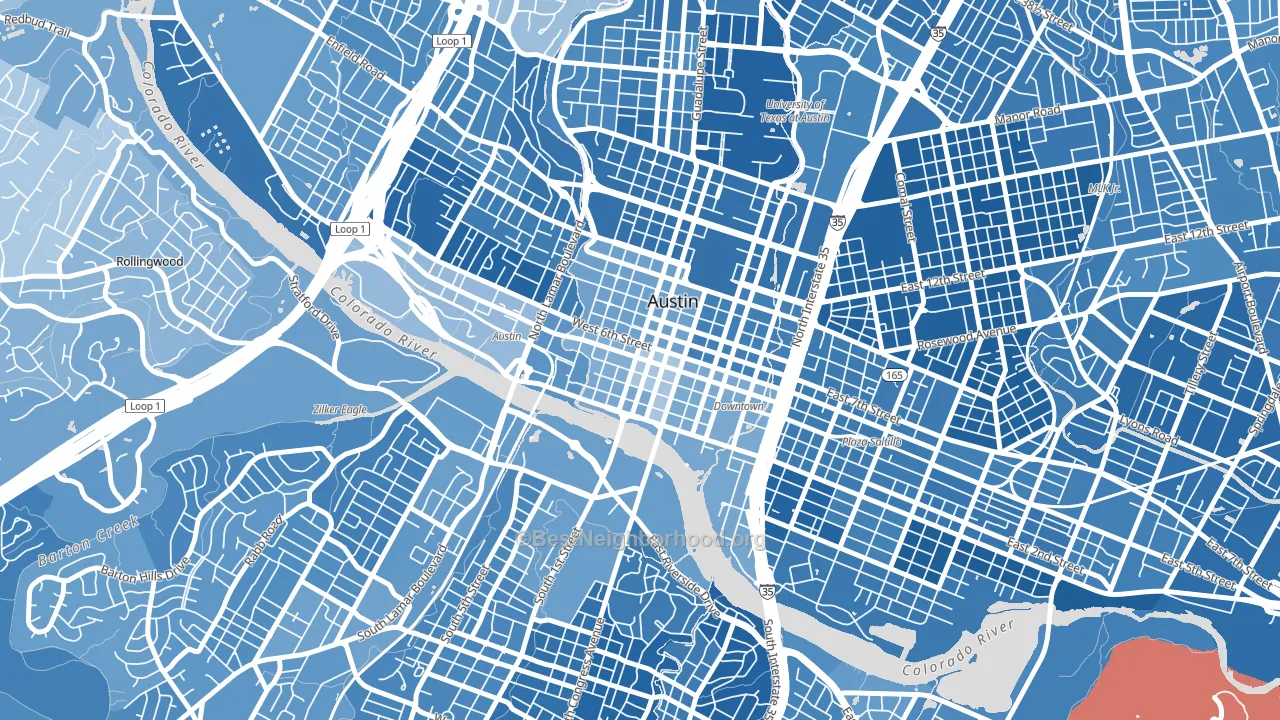
Downtown Austin leans heavily Democratic by roughly 42 points: about 71% of voters vote Democratic and 29% Republican.
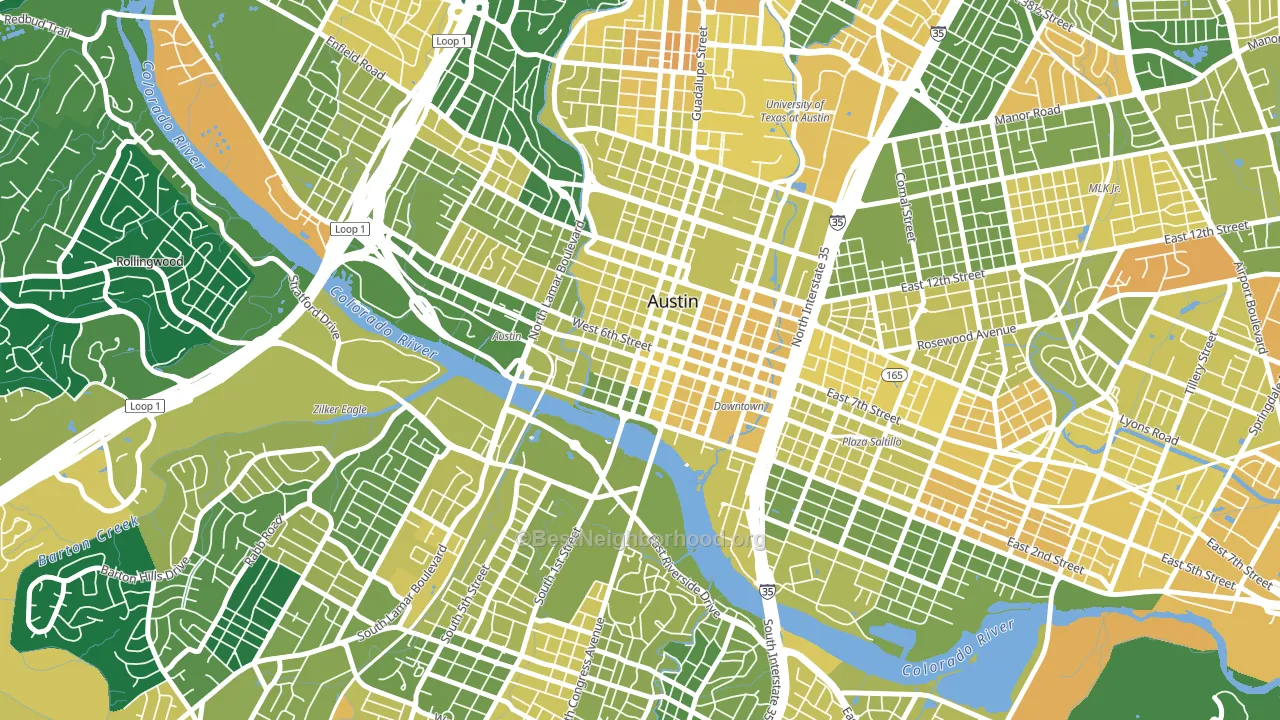
About 63% of adults in Downtown Austin typically vote, near the U.S. average of about 62%. Among adults in Downtown Austin, ~45% vote Democratic, ~18% Republican, and ~37% don't vote. The map below shows estimated turnout by block group.
How Downtown Austin compares
Among neighborhoods within 5 miles, Downtown Austin leans more Democratic than 2 of 36 neighbors.
Downtown Austin runs about 55 points more Democratic than Texas as a whole. Texas leans Republican overall, while Downtown Austin is one of the few Democratic-leaning pockets.
Politics vary noticeably by block within Downtown Austin. The north side is the most Democratic-leaning (D+60) and the south side is the least Democratic-leaning (D+32), a spread of about 27 points.
Why Downtown Austin leans the way it does
This analysis examined 14,881 data points per neighborhood to find what predicts political lean and turnout. The items below are a few correlations that stood out for Downtown Austin, not a ranked or complete list of what matters most.
Areas with high college attainment vote Democratic. About 82% of adults in Downtown Austin hold a bachelor's degree, about 53 points above the U.S. average of 28%. A high never-married share predicts Democratic voting, and about 52% of adults in Downtown Austin have never been married, above 84% of neighborhoods. Downtown Austin runs against the grain of Texas, a Democratic-leaning pocket in a Republican-leaning state.
Population density and Democratic lean
Places with high population density tend to lean Democratic; Downtown Austin, Austin, TX sits in the top tenth nationally on this measure.
Why turnout in Downtown Austin looks the way it does
Areas with high high-school completion turn out at higher rates. About 98% of adults in Downtown Austin have completed high school, about 12 points above the Texas average of 86%. Learn more about the findings and methodology on the political spectrum map.
Nearby Neighborhoods
- Clarksville, Austin, TX D+58
- East Cesar Chavez, Austin, TX D+62
- Central East Austin, Austin, TX D+64
- University Of Texas, Austin, TX D+67
- Bouldin, Austin, TX D+54
- West University Austin, Austin, TX D+57
- Zilker, Austin, TX D+45
- South River City, Austin, TX D+56
- Holly, Austin, TX D+62
- Windsor Road, Austin, TX D+41
Neighborhoods with Similar Populations
- Central, Cleveland, OH D+78
- Palolo, Honolulu, HI D+25
- Riverwest, Milwaukee, WI D+70
- Rancho Rinconada, Cupertino, CA D+33
- Estates Of Highland Creek, Katy, TX D+18
- Eastside Santa Ana, Santa Ana, CA D+33
- The Acre, Lowell, MA D+42
- Pawtucketville, Lowell, MA D+15
- Villages of Westcreek, San Antonio, TX D+7
- Seacliff, San Francisco, CA D+59
Sources and methodology
Precinct-level voting records used to fit the model come from Texas Secretary of State, Elections Division, distributed by the Voting and Election Science Team. Demographic inputs come from the U.S. Census Bureau (ACS 5-year estimates and the 2020 Decennial Census). Health and environmental inputs come from the CDC (PLACES and the Environmental Justice Index). Land cover comes from the USGS and EPA. Election-day and lead-up weather come from PRISM 4km daily grids and the NOAA Global Historical Climatology Network. Mail-voting and election-administration patterns come from the MIT Election Lab's Survey of the Performance of American Elections. Block-group crime detail comes from CrimeGrade. Internet data and modeling support provided by ISPreports.org.
Modeling and analysis by the BestNeighborhood data science team. Full methodology and findings: political spectrum map.
Methodology reviewed by the BestNeighborhood data team. Last updated May 2026.