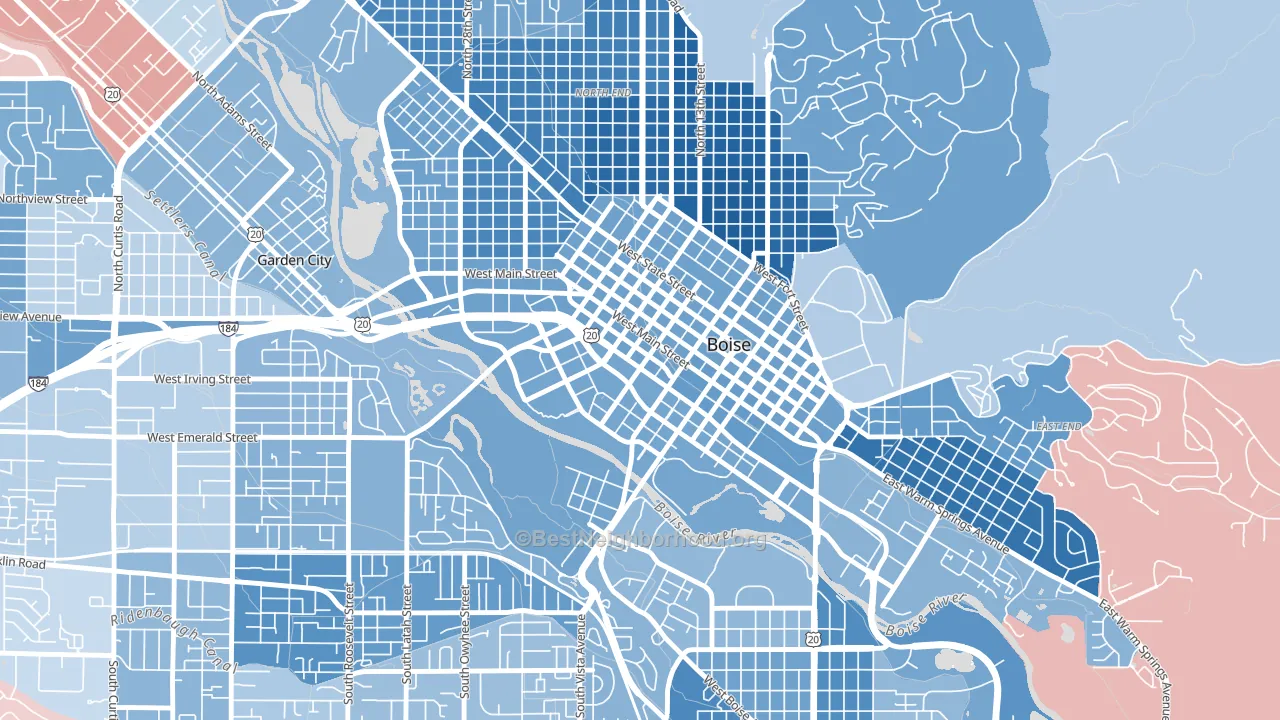
Downtown leans heavily Democratic by roughly 38 points: about 69% of voters vote Democratic and 31% Republican.
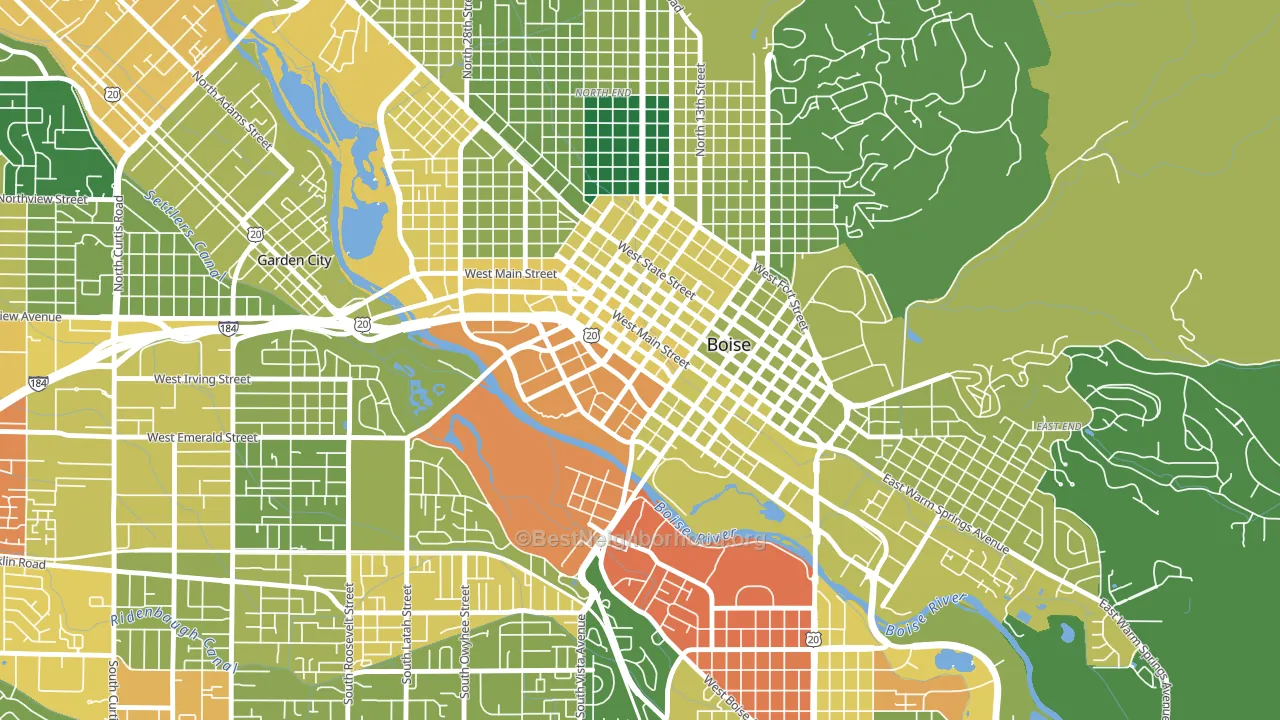
About 47% of adults in Downtown typically vote, below the U.S. average of about 62%. Among adults in Downtown, ~33% vote Democratic, ~15% Republican, and ~52% don't vote. The map below shows estimated turnout by block group.
How Downtown compares
Among neighborhoods within 5 miles, Downtown leans more Democratic than 12 of 14 neighbors.
Downtown runs about 74 points more Democratic than Idaho as a whole. Idaho leans Republican overall, while Downtown is one of the few Democratic-leaning pockets.
Politics vary noticeably by block within Downtown. The northeast side is the most Democratic-leaning (D+52) and the south side is the least Democratic-leaning (D+23), a spread of about 29 points.
Why Downtown leans the way it does
This analysis examined 14,881 data points per neighborhood to find what predicts political lean and turnout. The items below are a few correlations that stood out for Downtown, not a ranked or complete list of what matters most.
Downtown votes against the grain of Idaho. Idaho leans Republican overall, while Downtown runs about 74 points more Democratic. A high never-married share predicts Democratic voting, and about 48% of adults in Downtown have never been married, above 78% of neighborhoods.
Paved land cover and Democratic lean
Places with extensive paved surfaces tend to lean Democratic; Downtown, Boise, ID sits in the top tenth nationally on this measure. Paved ground does not change how people vote; it mostly reflects how urban and built-up a place is.
Why turnout in Downtown looks the way it does
Renters vote less often than owners. About 88% of households in Downtown rent, about 63 points above the U.S. average of 25%. High-crime urban areas turn out at lower rates, and Downtown sits in the top 15% on a violent-crime measure. Learn more about the findings and methodology on the political spectrum map.
Nearby Neighborhoods
- North End, Boise, ID D+57
- Depot Bench, Boise, ID D+35
- Veterans Park, Boise, ID D+29
- East End, Boise, ID D+33
- Sunset, Boise, ID D+44
- Central Bench, Boise, ID D+21
- Highlands, Boise, ID D+20
- Vista, Boise, ID D+18
- Winstead Park, Boise, ID D+20
- Hillcrest, Boise, ID D+10
Neighborhoods with Similar Populations
- Sherman, Madison, WI D+71
- Germantown, Louisville, KY D+59
- Wilshire, San Antonio, TX D+17
- Conservatory, Aurora, CO D+14
- Fairway Estates, Fort Collins, CO D+30
- McClymonds, Oakland, CA D+71
- Lake Road, Milwaukie, OR D+40
- Ashley Park, Charlotte, NC D+66
- Passaic Junction, Saddle Brook, NJ R+18
- Piscataquog, Manchester, NH D+24
Sources and methodology
Precinct-level voting records used to fit the model come from Idaho Secretary of State, Elections, distributed by the Voting and Election Science Team. Demographic inputs come from the U.S. Census Bureau (ACS 5-year estimates and the 2020 Decennial Census). Health and environmental inputs come from the CDC (PLACES and the Environmental Justice Index). Land cover comes from the USGS and EPA. Election-day and lead-up weather come from PRISM 4km daily grids and the NOAA Global Historical Climatology Network. Mail-voting and election-administration patterns come from the MIT Election Lab's Survey of the Performance of American Elections. Block-group crime detail comes from CrimeGrade. Internet data and modeling support provided by ISPreports.org.
Modeling and analysis by the BestNeighborhood data science team. Full methodology and findings: political spectrum map.
Methodology reviewed by the BestNeighborhood data team. Last updated May 2026.