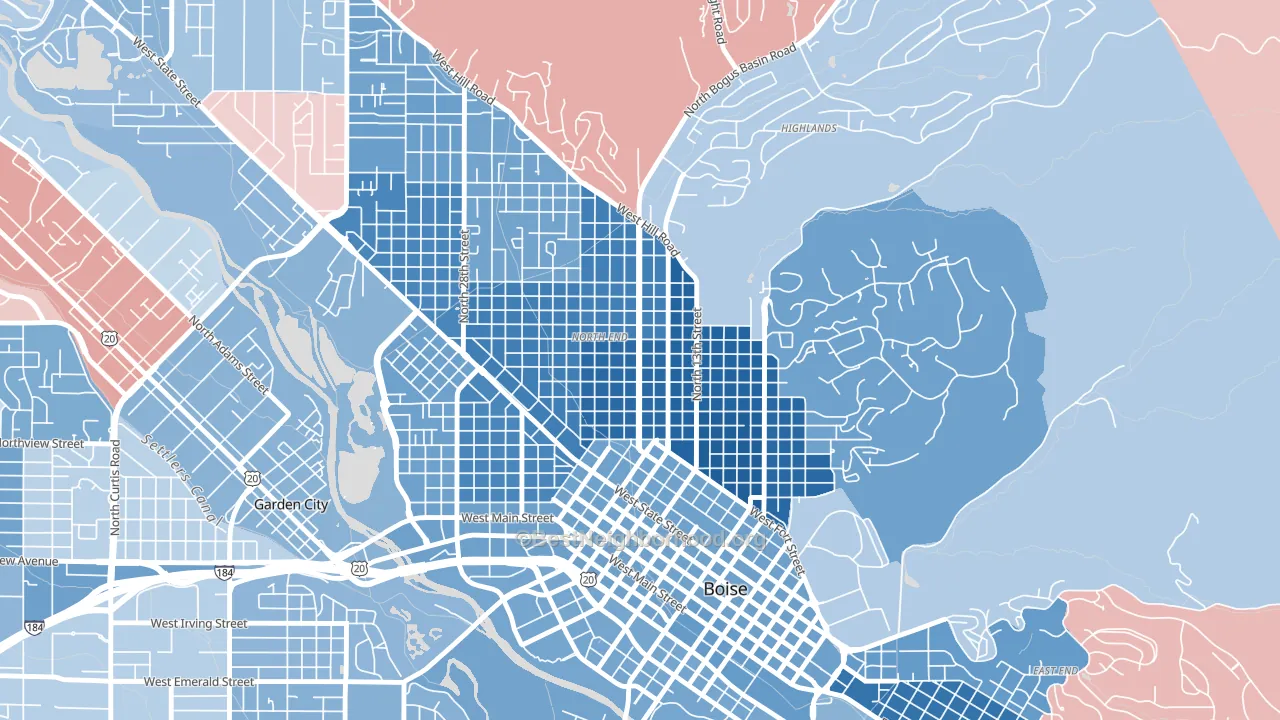
North End is a Democratic stronghold. About 78% of voters here vote Democratic and 22% Republican.
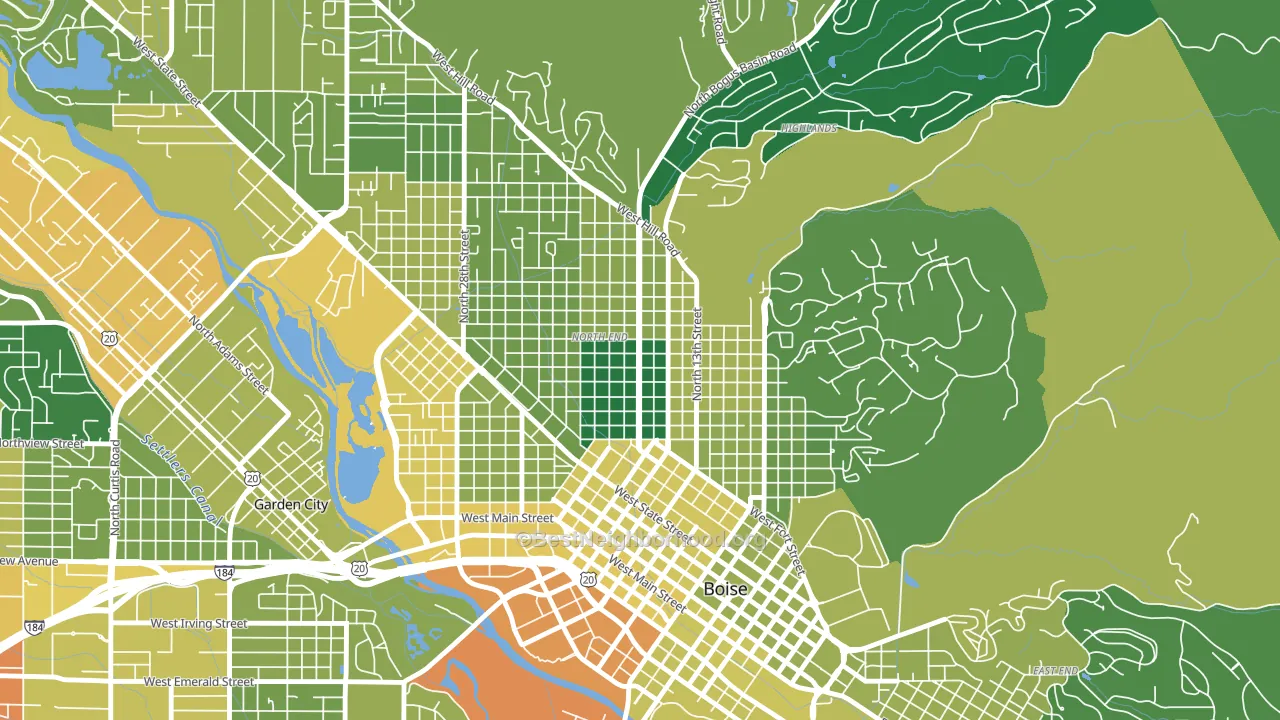
About 74% of adults in North End typically vote, above the U.S. average of about 62%. Among adults in North End, ~58% vote Democratic, ~16% Republican, and ~26% don't vote. The map below shows estimated turnout by block group.
How North End compares
Among neighborhoods within 5 miles, North End is the most Democratic-leaning.
North End runs about 93 points more Democratic than Idaho as a whole. Idaho leans Republican overall, while North End is one of the few Democratic-leaning pockets.
Politics vary noticeably by block within North End. The east side is the most Democratic-leaning (D+69) and the northwest side is the least Democratic-leaning (D+42), a spread of about 27 points.
Why North End leans the way it does
This analysis examined 14,881 data points per neighborhood to find what predicts political lean and turnout. The items below are a few correlations that stood out for North End, not a ranked or complete list of what matters most.
North End votes against the grain of Idaho. Idaho leans Republican overall, while North End runs about 93 points more Democratic. High college attainment predicts Democratic voting, and North End sits in the top quarter (about 62%, above 83% of neighborhoods).
Walkability and Democratic lean
Places with a highly walkable street grid tend to lean Democratic; North End, Boise, ID sits in the top quarter nationally on this measure. A walkable street grid does not change how people vote; it mostly reflects how urban a place is.
Why turnout in North End looks the way it does
Areas with strong routine healthcare access turn out at higher rates. North End is in the top quarter nationally for routine-care measures such as insurance coverage, preventive screenings, and dental visits. The dental-visit rate here is about 75%, about 15 points above the U.S. average of 60%. High high-school completion lines up with higher turnout, and about 99% of adults in North End have completed high school, above 88% of neighborhoods. Learn more about the findings and methodology on the political spectrum map.
Nearby Neighborhoods
- Downtown, Boise, ID D+37
- Veterans Park, Boise, ID D+29
- Sunset, Boise, ID D+44
- Highlands, Boise, ID D+20
- East End, Boise, ID D+33
- Depot Bench, Boise, ID D+35
- Winstead Park, Boise, ID D+20
- Central Bench, Boise, ID D+21
- Collister, Boise, ID D+21
- Vista, Boise, ID D+18
Neighborhoods with Similar Populations
- Burbank-Hayward, Hayward, CA D+42
- Penn, North Liberty, IA D+23
- Lasalle, Buffalo, NY D+78
- West Sugar Creek, Charlotte, NC D+71
- Lakeview, New Orleans, LA Even
- Henninger Park, Santa Ana, CA D+32
- Foxhill, Hampton, VA R+16
- Cleveland Heights, Oakland, CA D+74
- Jefferson Park, Chicago, IL D+22
- Glenwood, Glendale, CA D+12
Sources and methodology
Precinct-level voting records used to fit the model come from Idaho Secretary of State, Elections, distributed by the Voting and Election Science Team. Demographic inputs come from the U.S. Census Bureau (ACS 5-year estimates and the 2020 Decennial Census). Health and environmental inputs come from the CDC (PLACES and the Environmental Justice Index). Land cover comes from the USGS and EPA. Election-day and lead-up weather come from PRISM 4km daily grids and the NOAA Global Historical Climatology Network. Mail-voting and election-administration patterns come from the MIT Election Lab's Survey of the Performance of American Elections. Block-group crime detail comes from CrimeGrade. Internet data and modeling support provided by ISPreports.org.
Modeling and analysis by the BestNeighborhood data science team. Full methodology and findings: political spectrum map.
Methodology reviewed by the BestNeighborhood data team. Last updated May 2026.