Downtown Hamtramck leans slightly Republican by roughly 10 points: about 45% of voters vote Democratic and 55% Republican.
[sc name="abovemapcta"]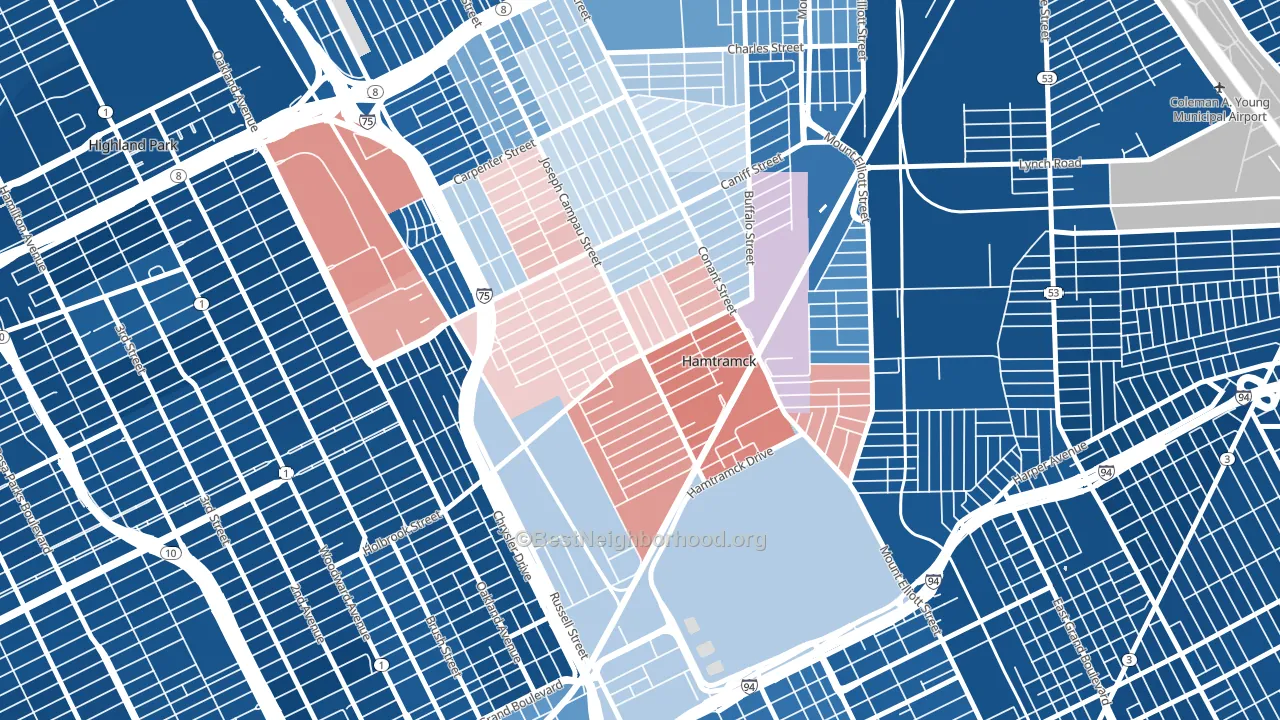 [bestneighborhood_map_controls]
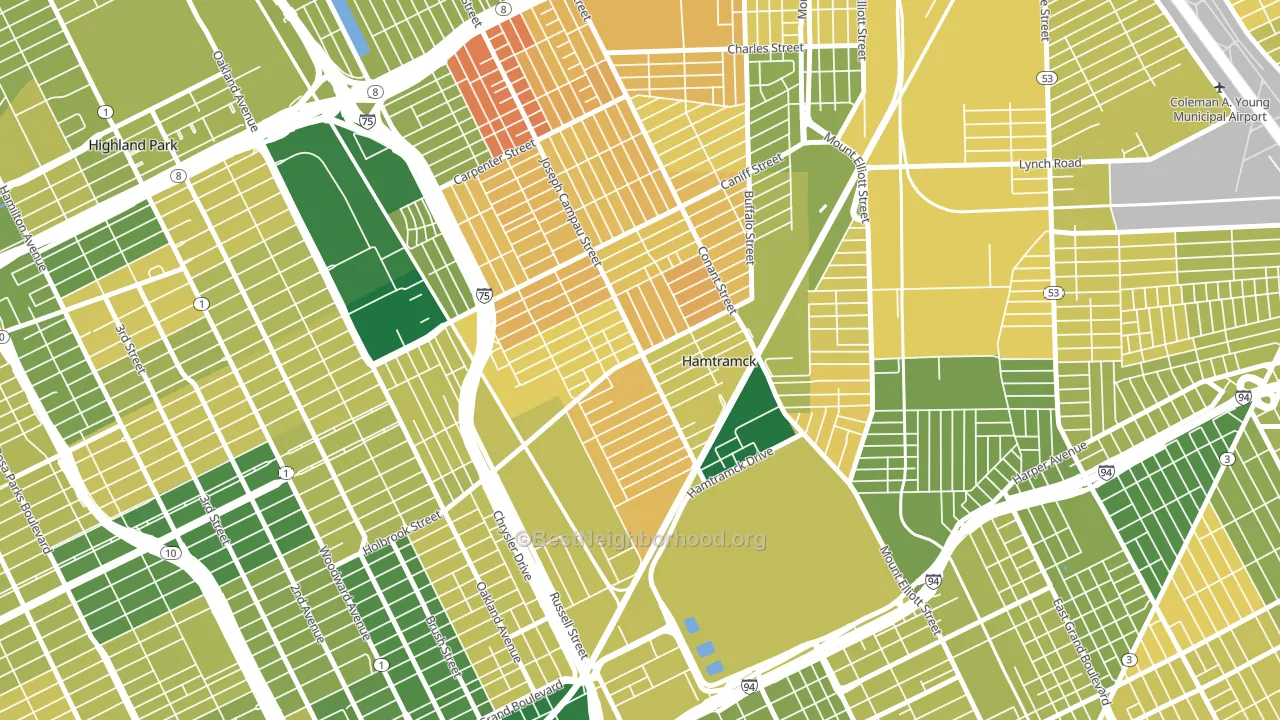
About 40% of adults in Downtown Hamtramck typically vote, below the U.S. average of about 62%. Among adults in Downtown Hamtramck, ~18% vote Democratic, ~22% Republican, and ~60% don't vote. The map below shows estimated turnout by block group.
 [bestneighborhood_map_controls]
How Downtown Hamtramck compares
Among neighborhoods within 5 miles, Downtown Hamtramck is the most Republican-leaning.
Downtown Hamtramck runs about 8 points more Republican than Michigan as a whole.
Politics vary noticeably by block within Downtown Hamtramck. The north side runs the most Democratic (D+5) and the west side runs the most Republican (R+15), a spread of about 20 points.
Why Downtown Hamtramck leans the way it does
This analysis examined 14,881 data points per neighborhood to find what predicts political lean and turnout. The items below are a few correlations that stood out for Downtown Hamtramck, not a ranked or complete list of what matters most.
Downtown Hamtramck votes Republican even though it is densely developed (more than 99%, far above the Michigan average of 31%). State and regional patterns outweigh the Democratic lean that density usually predicts here. Low college attainment predicts Republican voting, and Downtown Hamtramck sits in the bottom quarter (about 18%, below 81% of neighborhoods).
Preventive-care access and voter turnout
Places with limited routine preventive-care access tend to turn out at a lower rate; Downtown Hamtramck, Hamtramck, MI sits in the bottom quarter nationally on this measure. Dental visits do not drive turnout; the rate reflects income, insurance, and healthcare access, which line up with who votes.
Why turnout in Downtown Hamtramck looks the way it does
Areas with high food insecurity turn out at lower rates. About 38% of adults in Downtown Hamtramck report food insecurity, about 22 points above the U.S. average of 16%. Low high-school completion lines up with lower turnout, and about 64% of adults in Downtown Hamtramck have completed high school, below 97% of neighborhoods. High-crime urban areas turn out at lower rates, and Downtown Hamtramck sits in the top 15% on a violent-crime measure. Learn more about the findings and methodology on the political spectrum map.
[one_half]Nearby Neighborhoods
- Chene, Detroit, MI D+23
- Buffalo Charles, Detroit, MI D+14
- Airport, Detroit, MI D+57
- New Center, Detroit, MI D+80
- Boston Edison, Detroit, MI D+84
- Wayne State, Detroit, MI D+66
- Kettering-Butzel, Detroit, MI D+87
- Durfee, Detroit, MI D+85
- State Fair-Nolan, Highland Park, MI D+66
- Kranz Woods, Detroit, MI D+87
Neighborhoods with Similar Populations
- Downtown Fargo, Fargo, ND D+25
- Perry South, Pittsburgh, PA D+77
- Embrey Mill, Stafford, VA D+18
- West Lincoln, Lincoln, NE D+3
- West End Historic District, Dallas, TX D+33
- Ward Parkway, Kansas City, MO D+48
- Clifton, Louisville, KY D+59
- Sherwoods Manor, Stockton, CA D+8
- Hibiscus, Azalea Park, FL D+10
- Sugaw Creek, Charlotte, NC D+65
Sources and methodology
Precinct-level voting records used to fit the model come from Michigan Department of State, Elections, distributed by the Voting and Election Science Team. Demographic inputs come from the U.S. Census Bureau (ACS 5-year estimates and the 2020 Decennial Census). Health and environmental inputs come from the CDC (PLACES and the Environmental Justice Index). Land cover comes from the USGS and EPA. Election-day and lead-up weather come from PRISM 4km daily grids and the NOAA Global Historical Climatology Network. Mail-voting and election-administration patterns come from the MIT Election Lab's Survey of the Performance of American Elections. Block-group crime detail comes from CrimeGrade. Internet data and modeling support provided by ISPreports.org.
Modeling and analysis by the BestNeighborhood data science team. Full methodology and findings: political spectrum map.
Methodology reviewed by the BestNeighborhood data team. Last updated May 2026.