Kranz Woods is a Democratic stronghold. About 94% of voters here vote Democratic and 6% Republican.
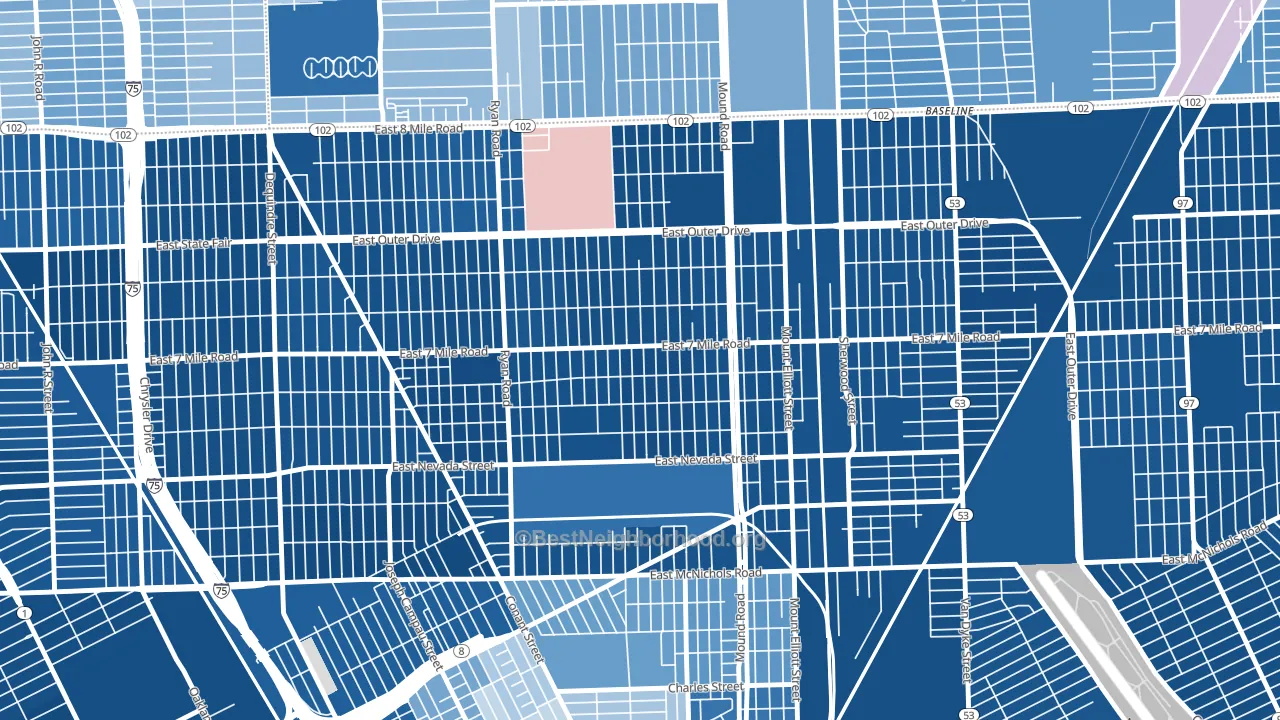
About 62% of adults in Kranz Woods typically vote, near the U.S. average of about 62%. Among adults in Kranz Woods, ~58% vote Democratic, ~4% Republican, and ~38% don't vote. The map below shows estimated turnout by block group.
How Kranz Woods compares
Among neighborhoods within 5 miles, Kranz Woods leans more Democratic than 21 of 22 neighbors.
Kranz Woods runs about 88 points more Democratic than Michigan as a whole. Michigan is roughly evenly split, and Kranz Woods sits clearly on the Democratic side.
Why Kranz Woods leans the way it does
This analysis examined 14,881 data points per neighborhood to find what predicts political lean and turnout. The items below are a few correlations that stood out for Kranz Woods, not a ranked or complete list of what matters most.
Density combined with diversity predicts Democratic voting. Non-Hispanic white share in Kranz Woods is about 3%, about 69 points below the U.S. average of 72%. A high never-married share predicts Democratic voting, and about 59% of adults in Kranz Woods have never been married, above 92% of neighborhoods. Kranz Woods runs against the grain of Michigan, a Democratic-leaning outlier in a roughly evenly split state.
Preventive-care access and voter turnout
Places with limited routine preventive-care access tend to turn out at a lower rate; Kranz Woods, Detroit, MI sits in the bottom quarter nationally on this measure. Dental visits do not drive turnout; the rate reflects income, insurance, and healthcare access, which line up with who votes.
Why turnout in Kranz Woods looks the way it does
Areas with high food insecurity turn out at lower rates. About 47% of adults in Kranz Woods report food insecurity, about 31 points above the U.S. average of 16%. High-crime urban areas turn out at lower rates, and Kranz Woods sits in the top 15% on a violent-crime measure. Learn more about the findings and methodology on the political spectrum map.
Nearby Neighborhoods
- Pershing, Detroit, MI D+86
- Conant Gardens, Detroit, MI D+86
- State Fair-Nolan, Highland Park, MI D+66
- Buffalo Charles, Detroit, MI D+14
- Airport, Detroit, MI D+57
- Van Steuban, Detroit, MI D+84
- Lasalle College Park, Detroit, MI D+87
- Downtown Hamtramck, Hamtramck, MI R+9
- Pulaski, Detroit, MI D+86
- Chene, Detroit, MI D+23
Neighborhoods with Similar Populations
- South San Gabriel, Rosemead, CA D+24
- Starmount Forest, Greensboro, NC D+39
- Collins Gardens, San Antonio, TX D+36
- Americana, Oak Ridge, FL D+57
- Lookout Valley, Chattanooga, TN R+38
- Ventura, San Antonio, TX D+22
- Candlewood Park, San Antonio, TX D+29
- South Fountain Avenue Historic District, Springfield, OH D+40
- Hampton Cove, Owens Cross Roads, AL R+37
- Groves Lincoln Park, Tucson, AZ Even
Sources and methodology
Precinct-level voting records used to fit the model come from Michigan Department of State, Elections, distributed by the Voting and Election Science Team. Demographic inputs come from the U.S. Census Bureau (ACS 5-year estimates and the 2020 Decennial Census). Health and environmental inputs come from the CDC (PLACES and the Environmental Justice Index). Land cover comes from the USGS and EPA. Election-day and lead-up weather come from PRISM 4km daily grids and the NOAA Global Historical Climatology Network. Mail-voting and election-administration patterns come from the MIT Election Lab's Survey of the Performance of American Elections. Block-group crime detail comes from CrimeGrade. Internet data and modeling support provided by ISPreports.org.
Modeling and analysis by the BestNeighborhood data science team. Full methodology and findings: political spectrum map.
Methodology reviewed by the BestNeighborhood data team. Last updated May 2026.