Midtown leans heavily Democratic by roughly 42 points: about 71% of voters vote Democratic and 29% Republican.
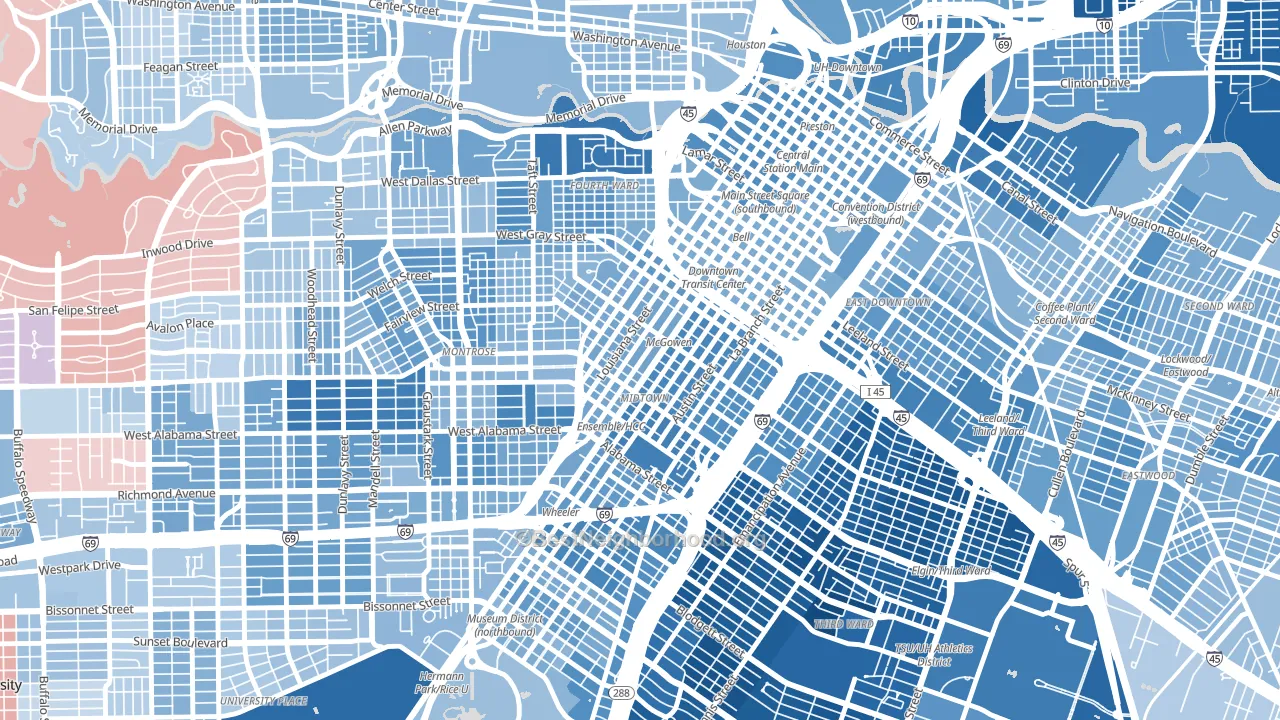
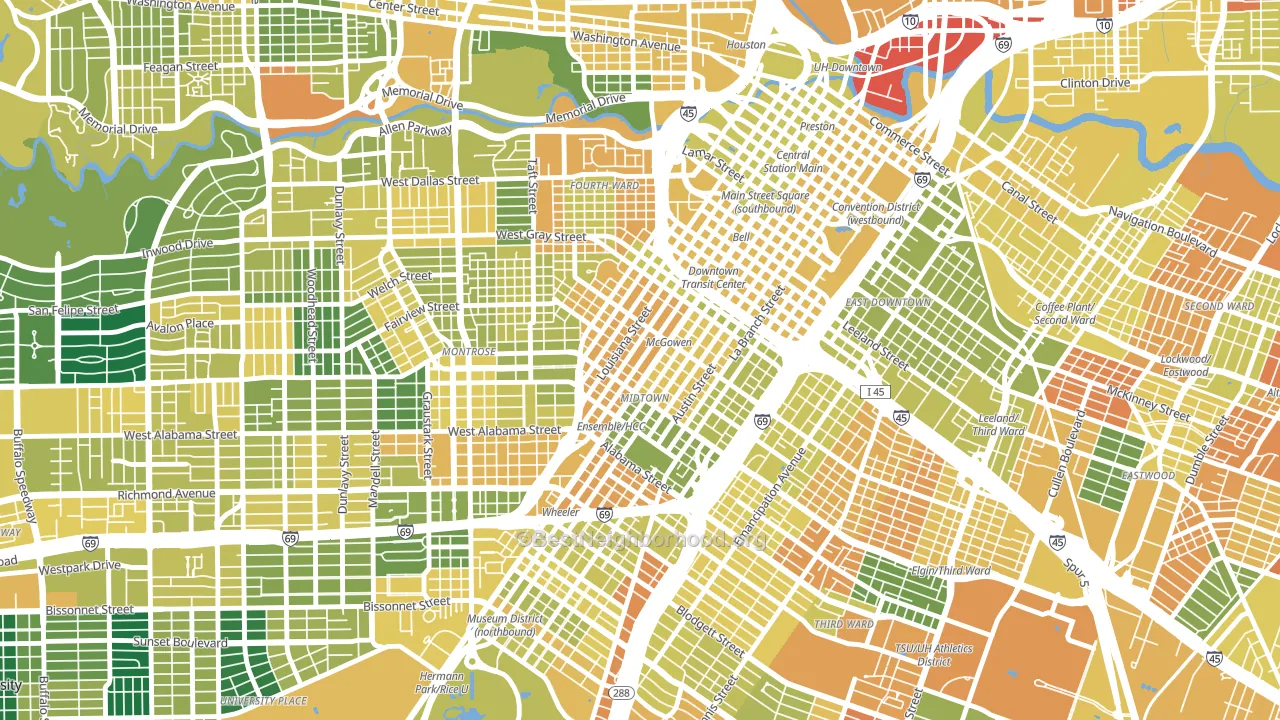
About 48% of adults in Midtown typically vote, below the U.S. average of about 62%. Among adults in Midtown, ~34% vote Democratic, ~14% Republican, and ~52% don't vote. The map below shows estimated turnout by block group.
How Midtown compares
Among neighborhoods within 5 miles, Midtown leans more Democratic than 9 of 12 neighbors.
Midtown runs about 55 points more Democratic than Texas as a whole. Texas leans Republican overall, while Midtown is one of the few Democratic-leaning pockets.
Politics vary noticeably by block within Midtown. The east side is the most Democratic-leaning (D+49) and the west side is the least Democratic-leaning (D+38), a spread of about 11 points.
Why Midtown leans the way it does
This analysis examined 14,881 data points per neighborhood to find what predicts political lean and turnout. The items below are a few correlations that stood out for Midtown, not a ranked or complete list of what matters most.
Dense areas vote Democratic. More than 99% of residents in Midtown live in densely developed areas, about 64 points above the U.S. average of 36%. High college attainment predicts Democratic voting, and Midtown sits in the top quarter (about 73%, above 92% of neighborhoods). Midtown runs against the grain of Texas, a Democratic-leaning pocket in a Republican-leaning state.
Population density and Democratic lean
Places with high population density tend to lean Democratic; Midtown, Houston, TX sits in the top tenth nationally on this measure.
Why turnout in Midtown looks the way it does
Renters vote less often than owners. About 77% of households in Midtown rent, about 52 points above the U.S. average of 25%. Learn more about the findings and methodology on the political spectrum map.
Nearby Neighborhoods
- Fourth Ward, Houston, TX D+47
- Montrose, Houston, TX D+39
- Downtown Houston, Houston, TX D+49
- Washington Avenue-Memorial Park, Houston, TX D+23
- Rice Military, Houston, TX D+22
- Rice, Houston, TX D+39
- River Oaks, Houston, TX D+11
- Medical, Houston, TX D+41
- Greater Fifth Ward, Houston, TX D+63
- Greater Heights, Houston, TX D+24
Neighborhoods with Similar Populations
- Love Field Area, Dallas, TX D+36
- Mt Pleasant, Cleveland, OH D+87
- Ballard, Seattle, WA D+73
- The Avenues, Salt Lake City, UT D+64
- Green Haven, Pasadena, MD R+13
- Ashburn Village, Ashburn, VA D+26
- Greenfield, Detroit, MI D+87
- Northwest Nashua, Nashua, NH D+23
- Lee-Miles, Cleveland, OH D+88
- Brooklyn-Curtis Bay, Brooklyn, MD D+37
Sources and methodology
Precinct-level voting records used to fit the model come from Texas Secretary of State, Elections Division, distributed by the Voting and Election Science Team. Demographic inputs come from the U.S. Census Bureau (ACS 5-year estimates and the 2020 Decennial Census). Health and environmental inputs come from the CDC (PLACES and the Environmental Justice Index). Land cover comes from the USGS and EPA. Election-day and lead-up weather come from PRISM 4km daily grids and the NOAA Global Historical Climatology Network. Mail-voting and election-administration patterns come from the MIT Election Lab's Survey of the Performance of American Elections. Block-group crime detail comes from CrimeGrade. Internet data and modeling support provided by ISPreports.org.
Modeling and analysis by the BestNeighborhood data science team. Full methodology and findings: political spectrum map.
Methodology reviewed by the BestNeighborhood data team. Last updated May 2026.