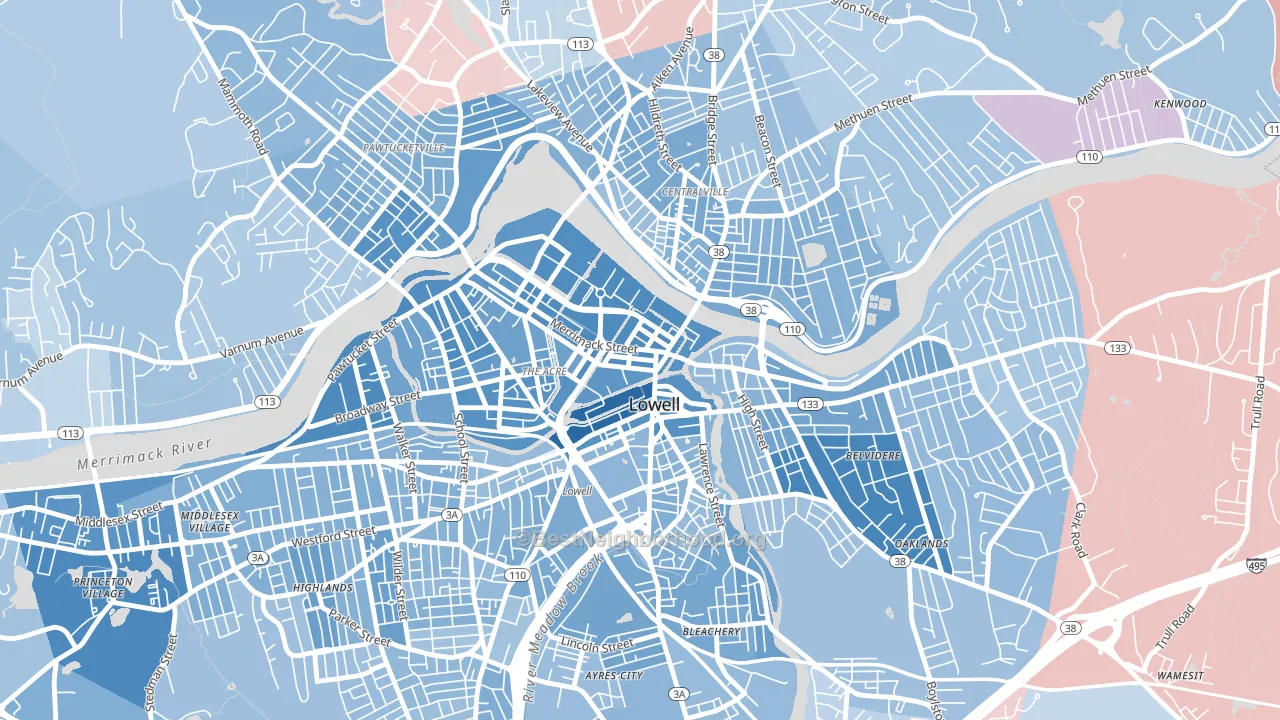
Downtown Lowell is a Democratic stronghold. About 77% of voters here vote Democratic and 23% Republican.
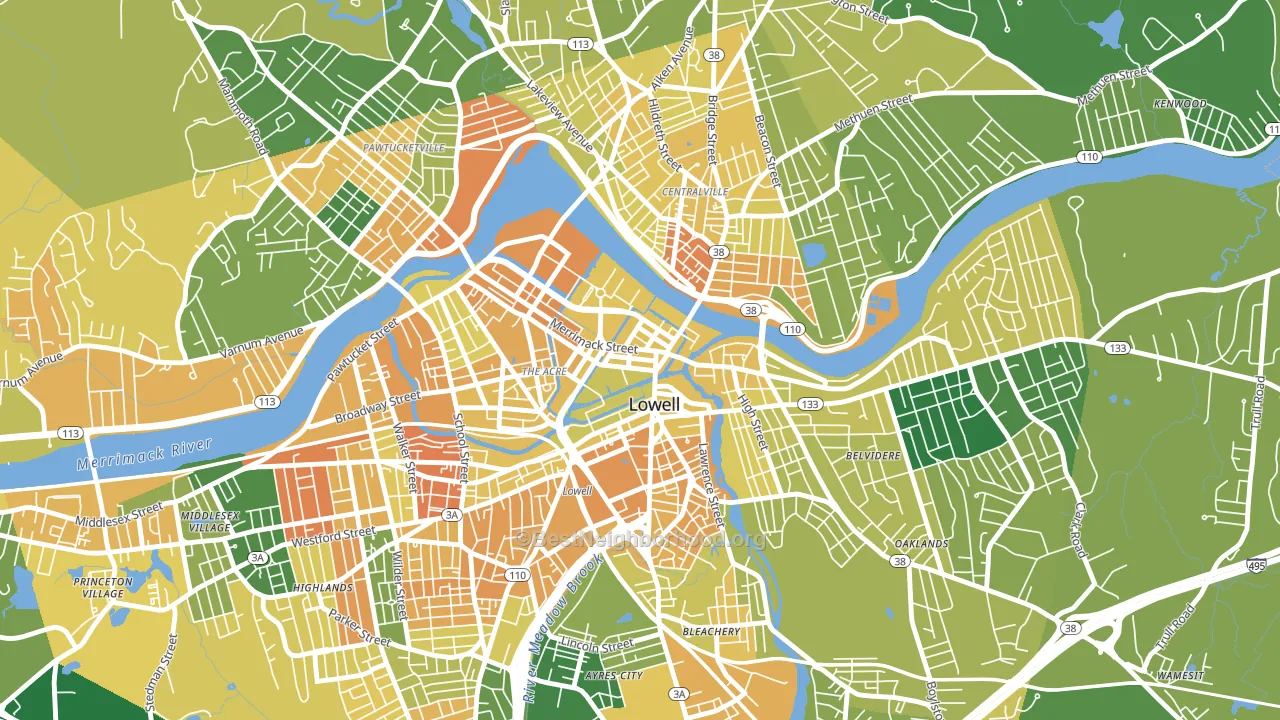
About 50% of adults in Downtown Lowell typically vote, below the U.S. average of about 62%. Among adults in Downtown Lowell, ~38% vote Democratic, ~11% Republican, and ~51% don't vote. The map below shows estimated turnout by block group.
How Downtown Lowell compares
Among neighborhoods within 5 miles, Downtown Lowell is the most Democratic-leaning.
Downtown Lowell runs about 28 points more Democratic than Massachusetts as a whole.
Why Downtown Lowell leans the way it does
Density, race composition, education, and family structure all sit close to their national averages in Downtown Lowell. The lean here lands roughly where demographic data alone would predict.
Paved land cover and Democratic lean
Places with extensive paved surfaces tend to lean Democratic; Downtown Lowell, Lowell, MA sits in the top tenth nationally on this measure. Paved ground does not change how people vote; it mostly reflects how urban and built-up a place is.
Why turnout in Downtown Lowell looks the way it does
Renters vote less often than owners. About 80% of households in Downtown Lowell rent, about 55 points above the U.S. average of 25%. High-crime urban areas turn out at lower rates, and Downtown Lowell sits in the top 15% on a violent-crime measure. Learn more about the findings and methodology on the political spectrum map.
Nearby Neighborhoods
Neighborhoods with Similar Populations
- Mount Hope, Providence, RI D+74
- Temescal, Oakland, CA D+83
- Lakeside Park, Tucson, AZ D+5
- Greenwood Forest, Houston, TX D+11
- Nevin Community, Charlotte, NC D+67
- West Redlands, Redlands, CA D+17
- Bank Square, Waltham, MA D+50
- Greater South, Lincoln, NE D+15
- Rancho El Dorado, Silver Bell, AZ R+6
- Southeast, Helena, MT D+22
Sources and methodology
Precinct-level voting records used to fit the model come from Massachusetts Secretary of the Commonwealth, Elections, distributed by the Voting and Election Science Team. Demographic inputs come from the U.S. Census Bureau (ACS 5-year estimates and the 2020 Decennial Census). Health and environmental inputs come from the CDC (PLACES and the Environmental Justice Index). Land cover comes from the USGS and EPA. Election-day and lead-up weather come from PRISM 4km daily grids and the NOAA Global Historical Climatology Network. Mail-voting and election-administration patterns come from the MIT Election Lab's Survey of the Performance of American Elections. Block-group crime detail comes from CrimeGrade. Internet data and modeling support provided by ISPreports.org.
Modeling and analysis by the BestNeighborhood data science team. Full methodology and findings: political spectrum map.
Methodology reviewed by the BestNeighborhood data team. Last updated May 2026.