Rancho El Dorado leans slightly Republican by roughly 6 points: about 47% of voters vote Democratic and 53% Republican.
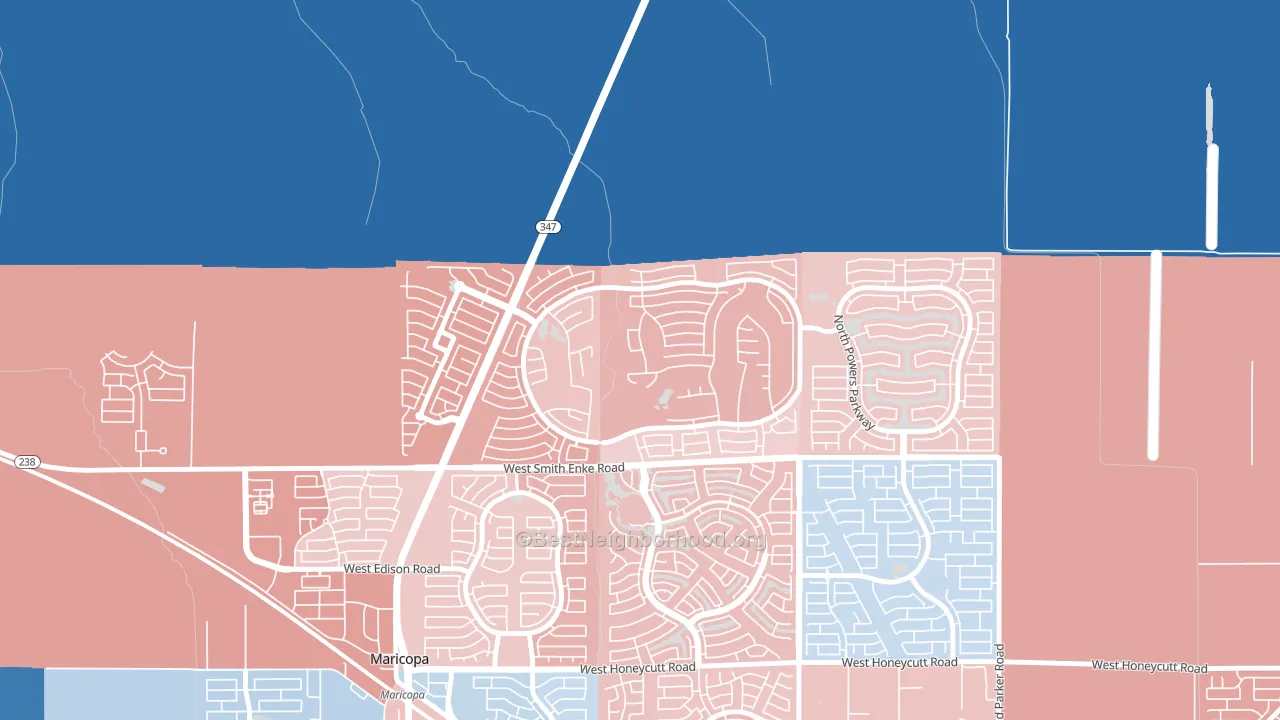
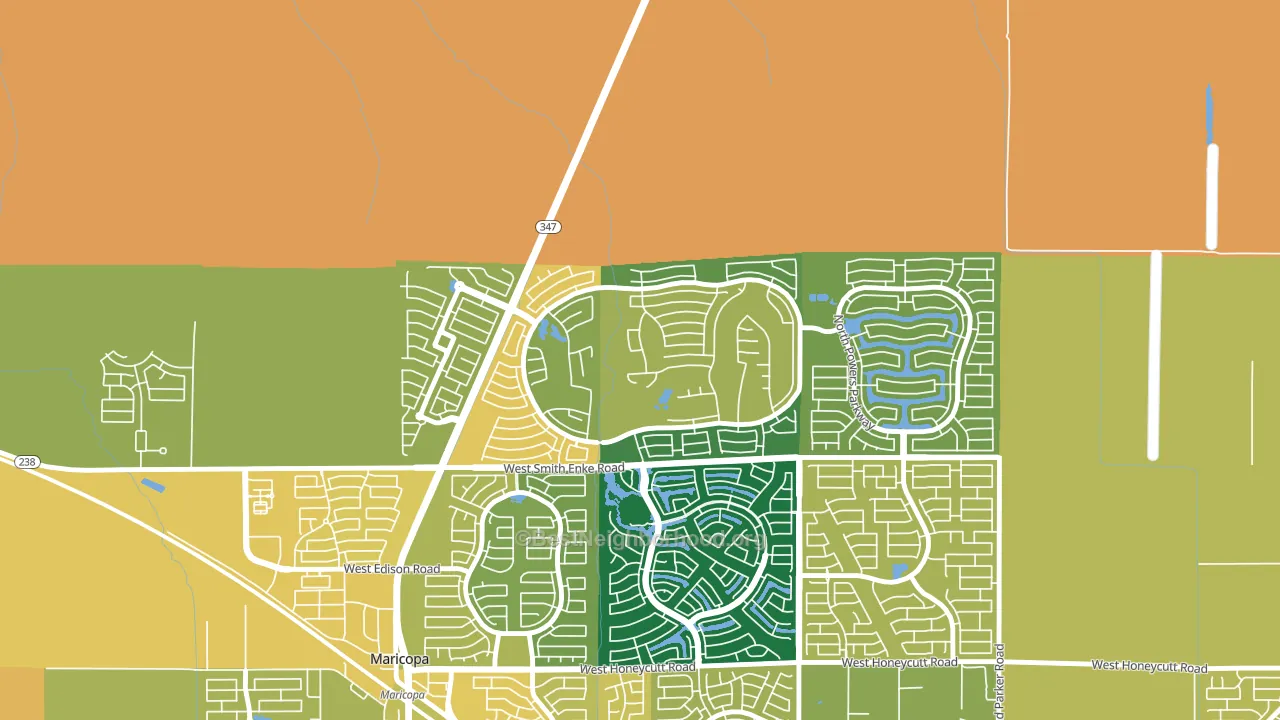
About 69% of adults in Rancho El Dorado typically vote, above the U.S. average of about 62%. Among adults in Rancho El Dorado, ~32% vote Democratic, ~36% Republican, and ~32% don't vote. The map below shows estimated turnout by block group.
How Rancho El Dorado compares
Politically, Rancho El Dorado sits close to the rest of Arizona.
Why Rancho El Dorado leans the way it does
This analysis examined 14,881 data points per neighborhood to find what predicts political lean and turnout. The items below are a few correlations that stood out for Rancho El Dorado, not a ranked or complete list of what matters most.
Areas with many family households vote Republican. About 79% of households in Rancho El Dorado are family households, about 12 points above the U.S. average of 67%.
Homeownership and voter turnout
Places with homeowner-heavy households tend to turn out at a higher rate; Rancho El Dorado, Silver Bell, AZ sits in the top quarter nationally on this measure.
Why turnout in Rancho El Dorado looks the way it does
Turnout in Rancho El Dorado sits close to the national pattern. Routine healthcare access, homeownership, education, and food security all land near their national averages here. Learn more about the findings and methodology on the political spectrum map.
Nearby Neighborhoods
- Villages at Rancho El Dorado, Silver Bell, AZ R+7
- Clemente Ranch, Chandler, AZ Even
- Ahwatukee, Phoenix, AZ D+6
- Sun Groves, Chandler, AZ R+8
- Downtown Chandler, Chandler, AZ D+22
- Tempe Royal Estates, Tempe, AZ D+22
- Wood Park, Tempe, AZ D+30
- Peterson, Tempe, AZ D+30
- South Phoenix, Phoenix, AZ D+30
- South Mountain, Phoenix, AZ D+35
Neighborhoods with Similar Populations
- Southeast, Helena, MT D+22
- Normandy Isles, North Bay Village, FL R+4
- Little Italy, San Diego, CA D+40
- Greenwood Forest, Houston, TX D+11
- Nevin Community, Charlotte, NC D+67
- Kashmere Gardens, Houston, TX D+70
- Pocono Farms, Tobyhanna, PA D+28
- Center Bluff, Peoria, IL D+47
- Valencia, Buckeye, AZ R+14
- Downtown Lowell, Lowell, MA D+53
Sources and methodology
Precinct-level voting records used to fit the model come from Arizona Secretary of State, Elections, distributed by the Voting and Election Science Team. Demographic inputs come from the U.S. Census Bureau (ACS 5-year estimates and the 2020 Decennial Census). Health and environmental inputs come from the CDC (PLACES and the Environmental Justice Index). Land cover comes from the USGS and EPA. Election-day and lead-up weather come from PRISM 4km daily grids and the NOAA Global Historical Climatology Network. Mail-voting and election-administration patterns come from the MIT Election Lab's Survey of the Performance of American Elections. Block-group crime detail comes from CrimeGrade. Internet data and modeling support provided by ISPreports.org.
Modeling and analysis by the BestNeighborhood data science team. Full methodology and findings: political spectrum map.
Methodology reviewed by the BestNeighborhood data team. Last updated May 2026.