Nevin Community is a Democratic stronghold. About 84% of voters here vote Democratic and 16% Republican.
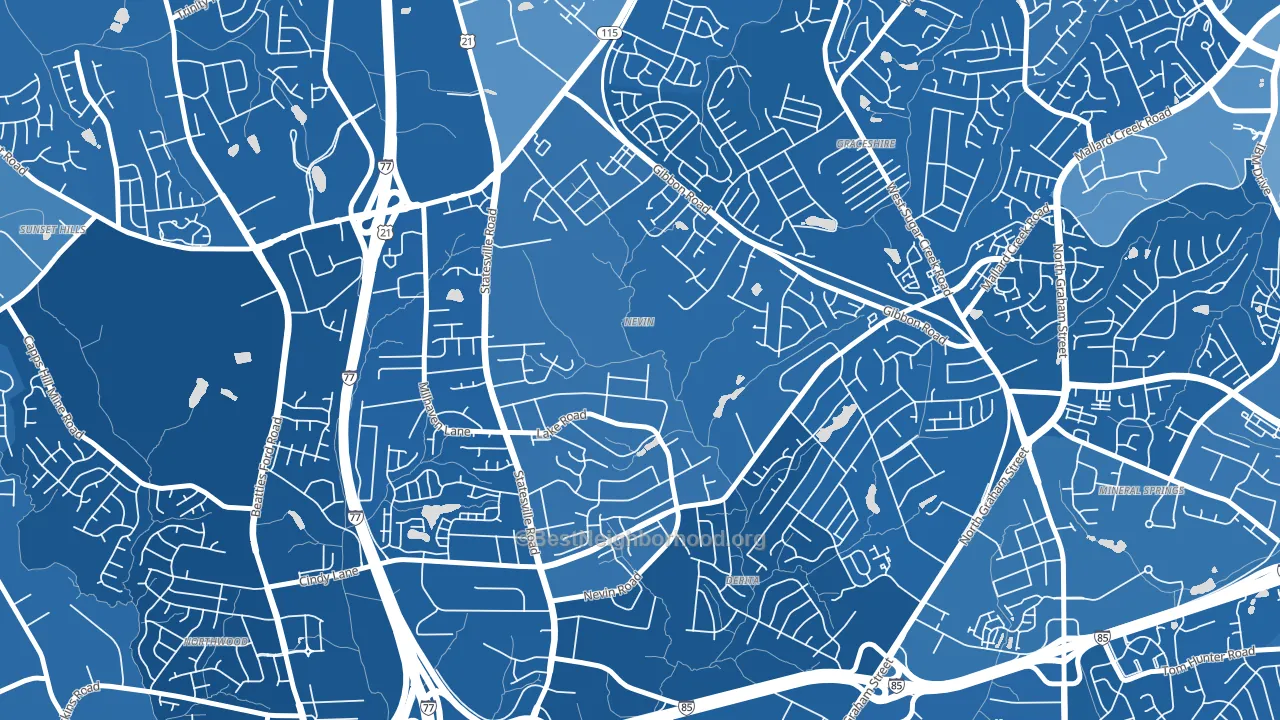
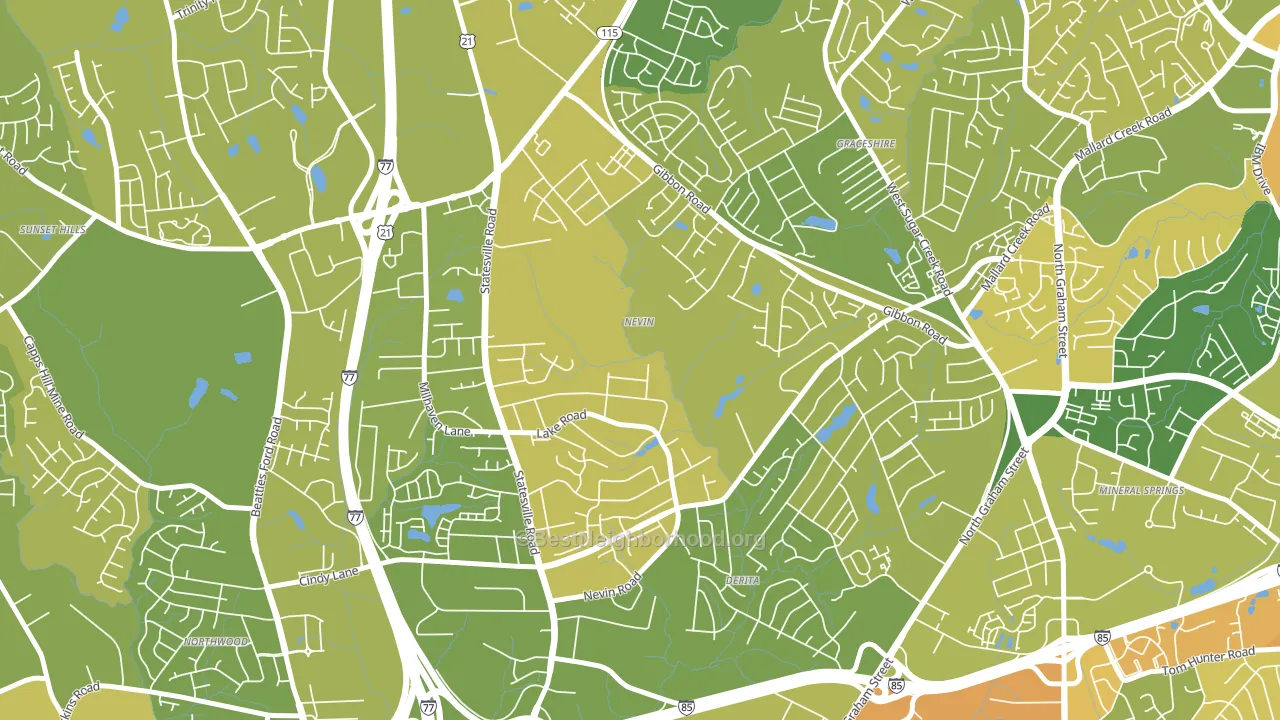
About 58% of adults in Nevin Community typically vote, near the U.S. average of about 62%. Among adults in Nevin Community, ~49% vote Democratic, ~9% Republican, and ~42% don't vote. The map below shows estimated turnout by block group.
How Nevin Community compares
Among neighborhoods within 5 miles, Nevin Community leans more Democratic than 10 of 21 neighbors.
Nevin Community runs about 71 points more Democratic than North Carolina as a whole. North Carolina leans Republican overall, while Nevin Community is one of the few Democratic-leaning pockets.
Why Nevin Community leans the way it does
This analysis examined 14,881 data points per neighborhood to find what predicts political lean and turnout. The items below are a few correlations that stood out for Nevin Community, not a ranked or complete list of what matters most.
Nevin Community votes against the grain of North Carolina. North Carolina leans Republican overall, while Nevin Community runs about 71 points more Democratic. Rural majority-Black areas vote Democratic, and about 48% of residents in Nevin Community are Black or African American, above 89% of neighborhoods. A high never-married share predicts Democratic voting, and about 49% of adults in Nevin Community have never been married, above 79% of neighborhoods.
Preventive-care access and voter turnout
Places with limited routine preventive-care access tend to turn out at a lower rate; Nevin Community, Charlotte, NC sits in the bottom quarter nationally on this measure. Dental visits do not drive turnout; the rate reflects income, insurance, and healthcare access, which line up with who votes.
Why turnout in Nevin Community looks the way it does
Areas with limited routine healthcare access turn out at lower rates. Nevin Community is in the bottom quarter nationally for routine-care measures such as insurance coverage, preventive screenings, and dental visits. High food insecurity lines up with lower turnout, and about 29% of adults in Nevin Community report food insecurity, above 81% of neighborhoods. Low high-school completion lines up with lower turnout, and about 83% of adults in Nevin Community have completed high school, below 81% of neighborhoods. Learn more about the findings and methodology on the political spectrum map.
Nearby Neighborhoods
- Derita-Statesville, Charlotte, NC D+75
- Slater Park, Charlotte, NC D+76
- Rockwell Park-Hemphill Heights, Charlotte, NC D+72
- Beatties Ford-Trinity, Charlotte, NC D+75
- West Sugar Creek, Charlotte, NC D+71
- Mineral Springs-Rumble Road, Charlotte, NC D+62
- Firestone-Garden Park, Charlotte, NC D+78
- Sugaw Creek, Charlotte, NC D+65
- Hidden Valley, Charlotte, NC D+68
- Wedgewood, Charlotte, NC D+66
Neighborhoods with Similar Populations
- Greenwood Forest, Houston, TX D+11
- Southeast, Helena, MT D+22
- Rancho El Dorado, Silver Bell, AZ R+6
- Normandy Isles, North Bay Village, FL R+4
- Little Italy, San Diego, CA D+40
- Kashmere Gardens, Houston, TX D+70
- Downtown Lowell, Lowell, MA D+53
- Pocono Farms, Tobyhanna, PA D+28
- Mount Hope, Providence, RI D+74
- Center Bluff, Peoria, IL D+47
Sources and methodology
Precinct-level voting records used to fit the model come from North Carolina State Board of Elections, distributed by the Voting and Election Science Team. Demographic inputs come from the U.S. Census Bureau (ACS 5-year estimates and the 2020 Decennial Census). Health and environmental inputs come from the CDC (PLACES and the Environmental Justice Index). Land cover comes from the USGS and EPA. Election-day and lead-up weather come from PRISM 4km daily grids and the NOAA Global Historical Climatology Network. Mail-voting and election-administration patterns come from the MIT Election Lab's Survey of the Performance of American Elections. Block-group crime detail comes from CrimeGrade. Internet data and modeling support provided by ISPreports.org.
Modeling and analysis by the BestNeighborhood data science team. Full methodology and findings: political spectrum map.
Methodology reviewed by the BestNeighborhood data team. Last updated May 2026.