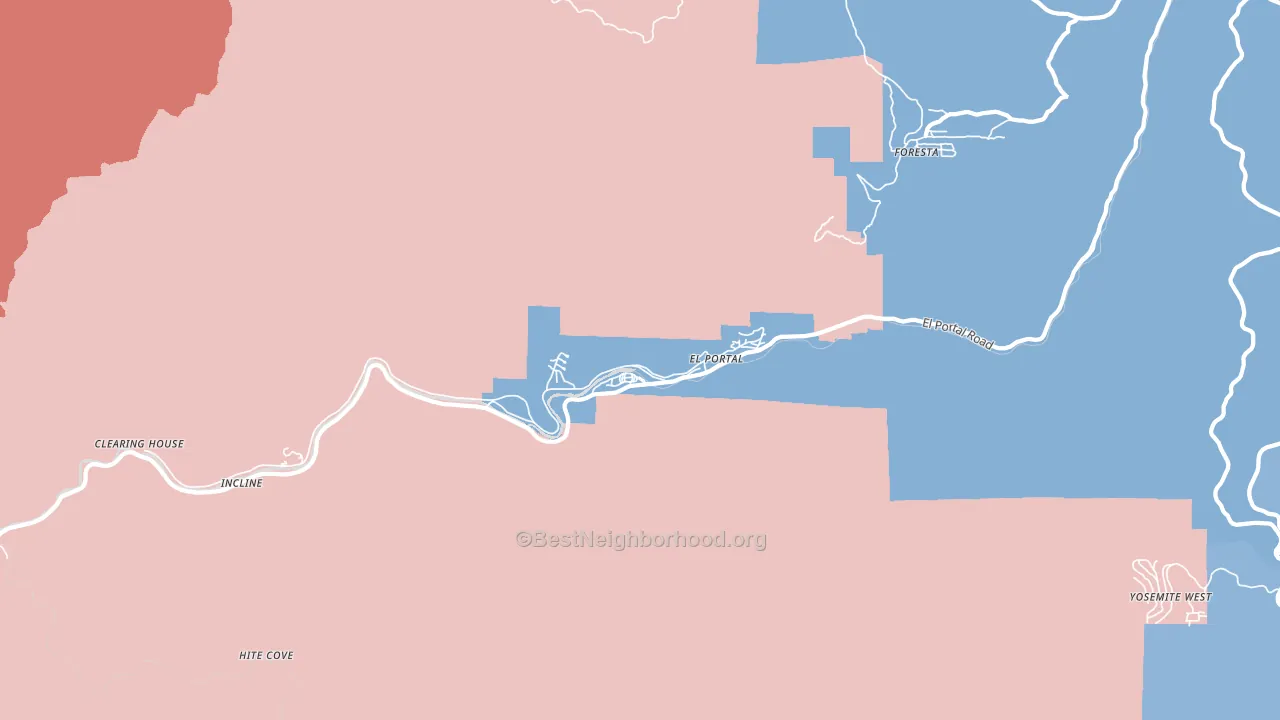
El Portal leans Democratic by roughly 22 points: about 61% of voters vote Democratic and 39% Republican.
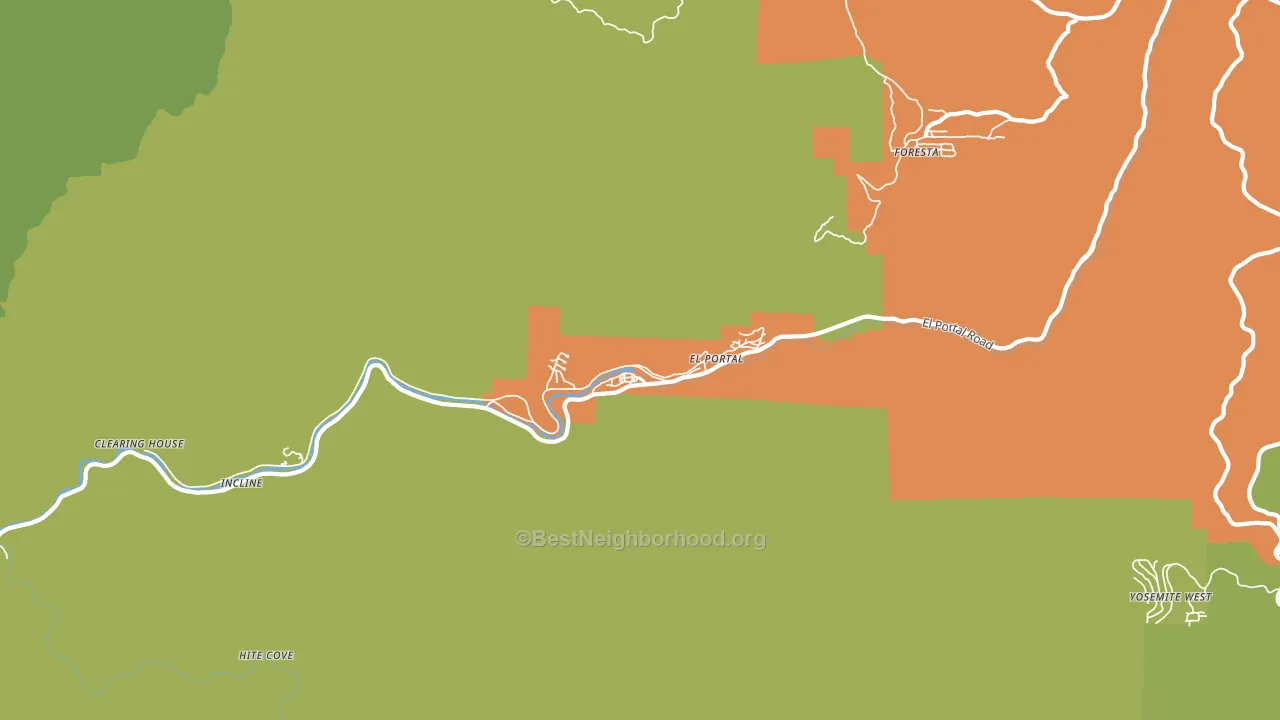
About 31% of adults in El Portal typically vote, below the U.S. average of about 62%. Among adults in El Portal, ~19% vote Democratic, ~12% Republican, and ~69% don't vote. The map below shows estimated turnout by block group.
How El Portal compares
Among cities within 25 miles, El Portal is the most Democratic-leaning.
Politically, El Portal sits close to the rest of California.
Why El Portal leans the way it does
This analysis examined 14,881 data points per city to find what predicts political lean and turnout. The items below are a few correlations that stood out for El Portal, not a ranked or complete list of what matters most.
Areas with high college attainment vote Democratic. About 42% of adults in El Portal hold a bachelor's degree, about 13 points above the U.S. average of 28%. A high never-married share predicts Democratic voting, and about 56% of adults in El Portal have never been married, in the top fraction of cities.
Homeownership and voter turnout
Places with renter-heavy households tend to turn out at a lower rate; El Portal, CA sits in the bottom tenth nationally on this measure.
Why turnout in El Portal looks the way it does
Renters vote less often than owners. About 60% of households in El Portal rent, about 35 points above the U.S. average of 25%. Crowded housing lines up with lower turnout, and about 5% of homes in El Portal have more than one occupant per room, above 87% of cities. Learn more about the findings and methodology on the political spectrum map.
Nearby Cities
- Incline, CA R+19
- Sugar Pine, CA R+15
- Foresta, CA R+11
- Yosemite National Park, CA D+18
- Midpines, CA D+7
- Yosemite Junction, CA D+16
- Darrah, CA R+19
- Fish Camp, CA R+6
- Mariposa, CA R+9
Cities with Similar Populations
- Oyens, IA R+59
- Alburg Center, VT R+22
- Whiting, KS R+56
- Patronville, IN R+53
- Lucile, GA R+53
- Pisgah Heights, MI R+53
- Holliday, IL R+65
- Stavanger, IL R+39
- Chipman, TN R+62
- Dighton, OK R+58
Sources and methodology
Precinct-level voting records used to fit the model come from California Secretary of State, Elections, distributed by the Voting and Election Science Team. Demographic inputs come from the U.S. Census Bureau (ACS 5-year estimates and the 2020 Decennial Census). Health and environmental inputs come from the CDC (PLACES and the Environmental Justice Index). Land cover comes from the USGS and EPA. Election-day and lead-up weather come from PRISM 4km daily grids and the NOAA Global Historical Climatology Network. Mail-voting and election-administration patterns come from the MIT Election Lab's Survey of the Performance of American Elections. Block-group crime detail comes from CrimeGrade. Internet data and modeling support provided by ISPreports.org.
Modeling and analysis by the BestNeighborhood data science team. Full methodology and findings: political spectrum map.
Methodology reviewed by the BestNeighborhood data team. Last updated May 2026.