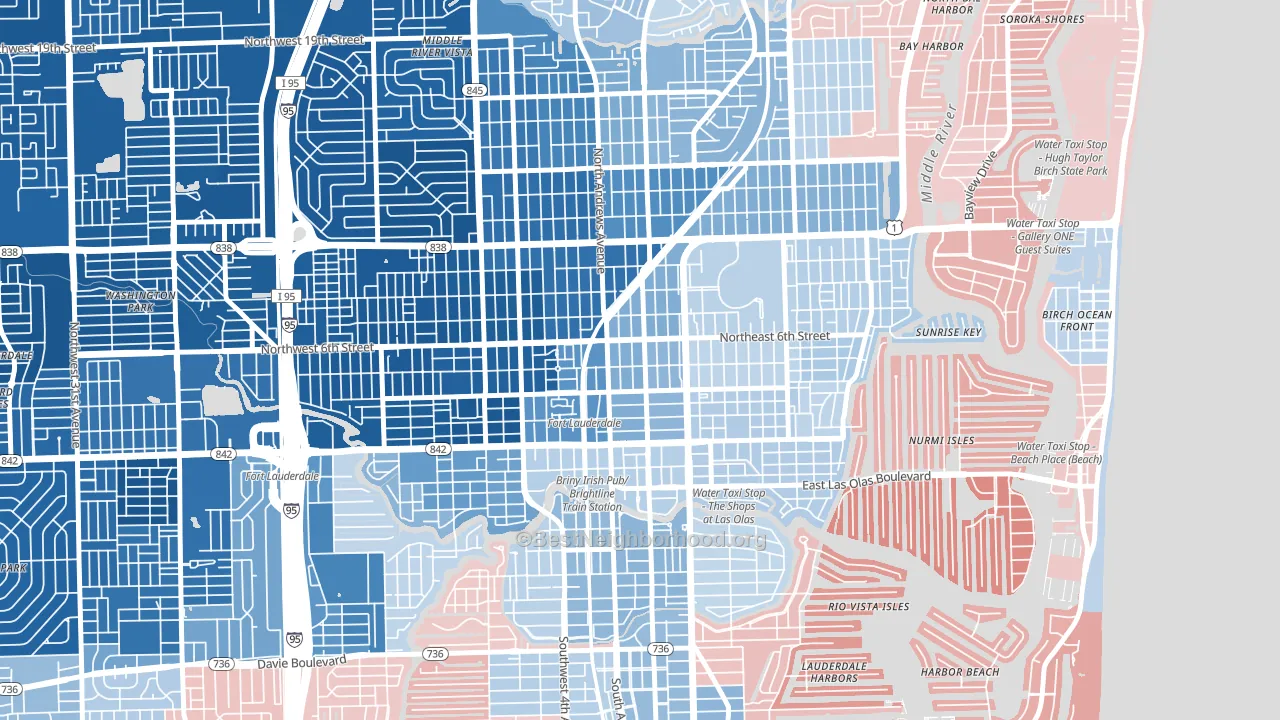
Flagler Heights leans Democratic by roughly 20 points: about 60% of voters vote Democratic and 40% Republican.
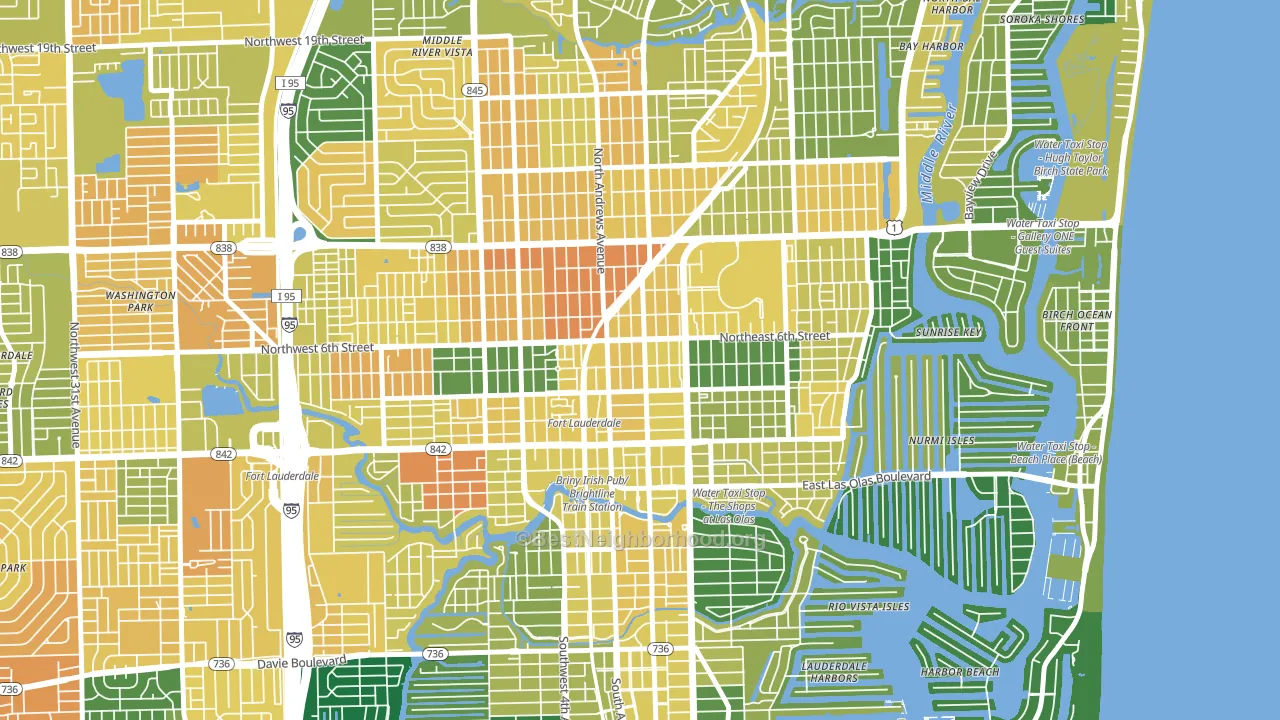
About 49% of adults in Flagler Heights typically vote, below the U.S. average of about 62%. Among adults in Flagler Heights, ~29% vote Democratic, ~20% Republican, and ~51% don't vote. The map below shows estimated turnout by block group.
How Flagler Heights compares
Among neighborhoods within 5 miles, Flagler Heights leans more Democratic than 14 of 22 neighbors.
Flagler Heights runs about 33 points more Democratic than Florida as a whole. Florida leans Republican overall, while Flagler Heights is one of the few Democratic-leaning pockets.
Politics vary noticeably by block within Flagler Heights. The west side is the most Democratic-leaning (D+44) and the southeast side is the least Democratic-leaning (D+12), a spread of about 32 points.
Why Flagler Heights leans the way it does
This analysis examined 14,881 data points per neighborhood to find what predicts political lean and turnout. The items below are a few correlations that stood out for Flagler Heights, not a ranked or complete list of what matters most.
Dense areas vote Democratic. More than 99% of residents in Flagler Heights live in densely developed areas, about 64 points above the U.S. average of 36%. High college attainment predicts Democratic voting, and Flagler Heights sits in the top quarter (about 59%, above 80% of neighborhoods). Flagler Heights runs against the grain of Florida, a Democratic-leaning pocket in a Republican-leaning state.
Walkability and Democratic lean
Places with a highly walkable street grid tend to lean Democratic; Flagler Heights, Fort Lauderdale, FL sits in the top tenth nationally on this measure. A walkable street grid does not change how people vote; it mostly reflects how urban a place is.
Why turnout in Flagler Heights looks the way it does
Renters vote less often than owners. About 92% of households in Flagler Heights rent, about 67 points above the U.S. average of 25%. High-crime urban areas turn out at lower rates, and Flagler Heights sits in the top 15% on a violent-crime measure. Learn more about the findings and methodology on the political spectrum map.
Nearby Neighborhoods
- Downtown Fort Lauderdale, Fort Lauderdale, FL D+5
- Victoria Park, Fort Lauderdale, FL D+6
- Lake Ridge, Fort Lauderdale, FL D+17
- Tarpon River, Fort Lauderdale, FL D+4
- Dorsey-Riverbend, Fort Lauderdale, FL D+78
- South Middle River, Fort Lauderdale, FL D+56
- Middle River Terrace, Fort Lauderdale, FL D+40
- Durrs Homeowners, Fort Lauderdale, FL D+80
- Riverside Park, Fort Lauderdale, FL D+34
- Lauderdale Manors, Fort Lauderdale, FL D+77
Neighborhoods with Similar Populations
- Angelo Heights, San Angelo, TX R+22
- Lakewood Springs, Plano, IL Even
- Lely Resort, Naples, FL R+15
- Near N Valley, Albuquerque, NM D+42
- Audubon Place, Tuscaloosa, AL D+14
- Downtown Huntington Beach, Huntington Beach, CA Even
- Meadow Village, San Antonio, TX D+24
- Clinton, Oakland, CA D+58
- New Tampa, Tampa, FL D+14
- Highlands Historic District, State College, PA D+36
Sources and methodology
Precinct-level voting records used to fit the model come from Florida Division of Elections, distributed by the Voting and Election Science Team. Demographic inputs come from the U.S. Census Bureau (ACS 5-year estimates and the 2020 Decennial Census). Health and environmental inputs come from the CDC (PLACES and the Environmental Justice Index). Land cover comes from the USGS and EPA. Election-day and lead-up weather come from PRISM 4km daily grids and the NOAA Global Historical Climatology Network. Mail-voting and election-administration patterns come from the MIT Election Lab's Survey of the Performance of American Elections. Block-group crime detail comes from CrimeGrade. Internet data and modeling support provided by ISPreports.org.
Modeling and analysis by the BestNeighborhood data science team. Full methodology and findings: political spectrum map.
Methodology reviewed by the BestNeighborhood data team. Last updated May 2026.