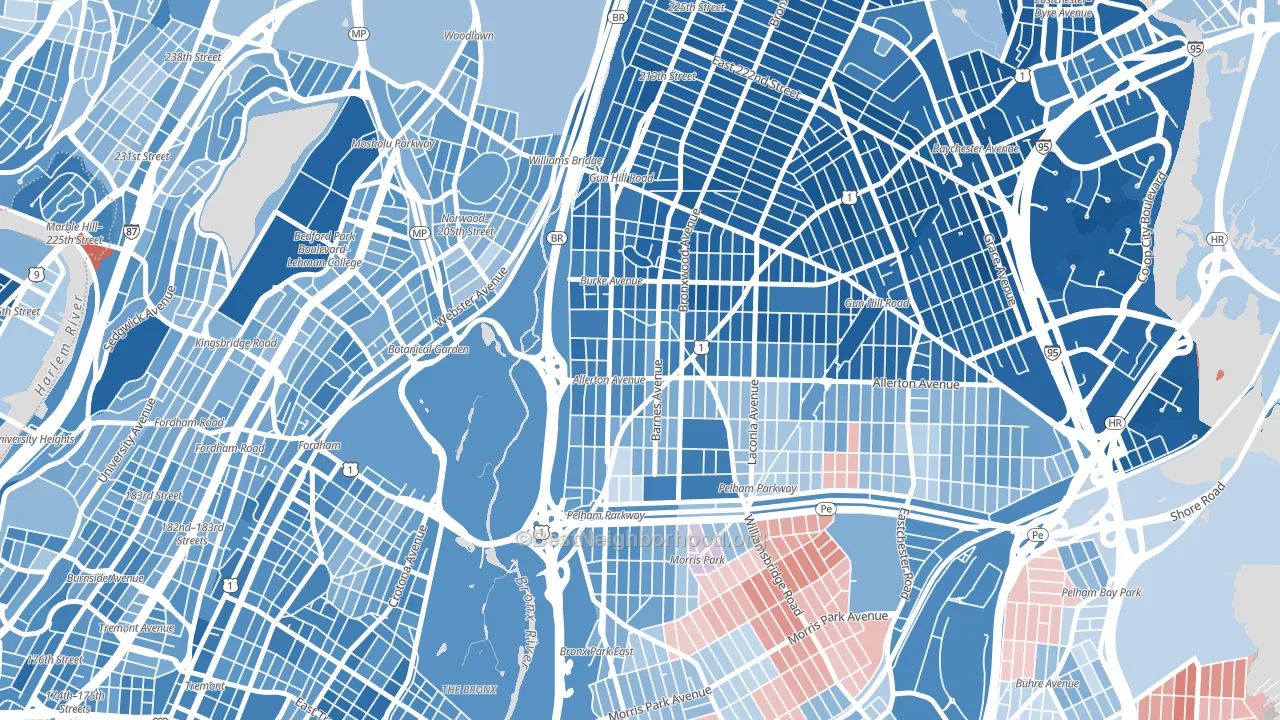
Williamsbridge leans heavily Democratic by roughly 46 points: about 73% of voters vote Democratic and 27% Republican.
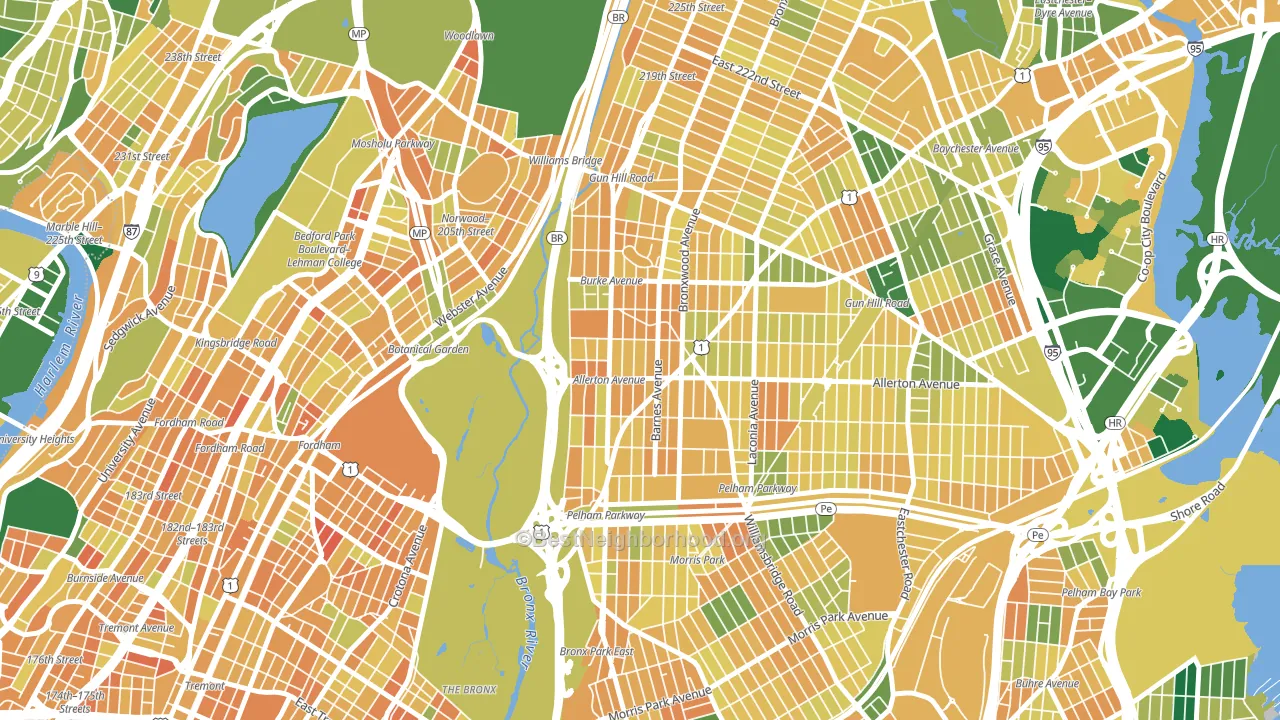
About 41% of adults in Williamsbridge typically vote, below the U.S. average of about 62%. Among adults in Williamsbridge, ~30% vote Democratic, ~11% Republican, and ~59% don't vote. The map below shows estimated turnout by block group.
How Williamsbridge compares
Among neighborhoods within 5 miles, Williamsbridge leans more Democratic than 28 of 40 neighbors.
Williamsbridge runs about 34 points more Democratic than New York as a whole.
Politics vary noticeably by block within Williamsbridge. The northeast side is the most Democratic-leaning (D+71) and the south side is the least Democratic-leaning (D+27), a spread of about 44 points.
Why Williamsbridge leans the way it does
This analysis examined 14,881 data points per neighborhood to find what predicts political lean and turnout. The items below are a few correlations that stood out for Williamsbridge, not a ranked or complete list of what matters most.
Density combined with diversity predicts Democratic voting. Non-Hispanic white share in Williamsbridge is about 10%, about 62 points below the U.S. average of 72%.
Population density and Democratic lean
Places with high population density tend to lean Democratic; Williamsbridge, Bronx, NY sits in the top tenth nationally on this measure.
Why turnout in Williamsbridge looks the way it does
Renters vote less often than owners. About 77% of households in Williamsbridge rent, about 52 points above the U.S. average of 25%. High food insecurity lines up with lower turnout, and about 35% of adults in Williamsbridge report food insecurity, above 88% of neighborhoods. Low high-school completion lines up with lower turnout, and about 77% of adults in Williamsbridge have completed high school, below 89% of neighborhoods. Learn more about the findings and methodology on the political spectrum map.
Nearby Neighborhoods
- Baychester, Bronx, NY D+51
- Bronxdale, Bronx, NY D+31
- Morris Park, Bronx, NY Even
- Bedford Park, Bronx, NY D+33
- Van Nest, Bronx, NY D+19
- Belmont, Bronx, NY D+43
- Fordham, Bronx, NY D+36
- Wakefield-Williamsbridge, Bronx, NY D+73
- Country Club, Bronx, NY D+66
- Parkchester, Bronx, NY D+35
Neighborhoods with Similar Populations
- El Rancho, Pico Rivera, CA D+29
- Woodside, Queens, NY D+15
- University City, San Diego, CA D+44
- East Harlem, Manhattan, NY D+61
- Southwestern Denver, Denver, CO D+32
- Midtown-Memphis, Memphis, TN D+66
- Michael Way, Las Vegas, NV D+22
- Eagle Rock, Los Angeles, CA D+49
- Lower Valley, El Paso, TX D+27
- Westchester, Los Angeles, CA D+47
Sources and methodology
Precinct-level voting records used to fit the model come from New York State Board of Elections, distributed by the Voting and Election Science Team. Demographic inputs come from the U.S. Census Bureau (ACS 5-year estimates and the 2020 Decennial Census). Health and environmental inputs come from the CDC (PLACES and the Environmental Justice Index). Land cover comes from the USGS and EPA. Election-day and lead-up weather come from PRISM 4km daily grids and the NOAA Global Historical Climatology Network. Mail-voting and election-administration patterns come from the MIT Election Lab's Survey of the Performance of American Elections. Block-group crime detail comes from CrimeGrade. Internet data and modeling support provided by ISPreports.org.
Modeling and analysis by the BestNeighborhood data science team. Full methodology and findings: political spectrum map.
Methodology reviewed by the BestNeighborhood data team. Last updated May 2026.