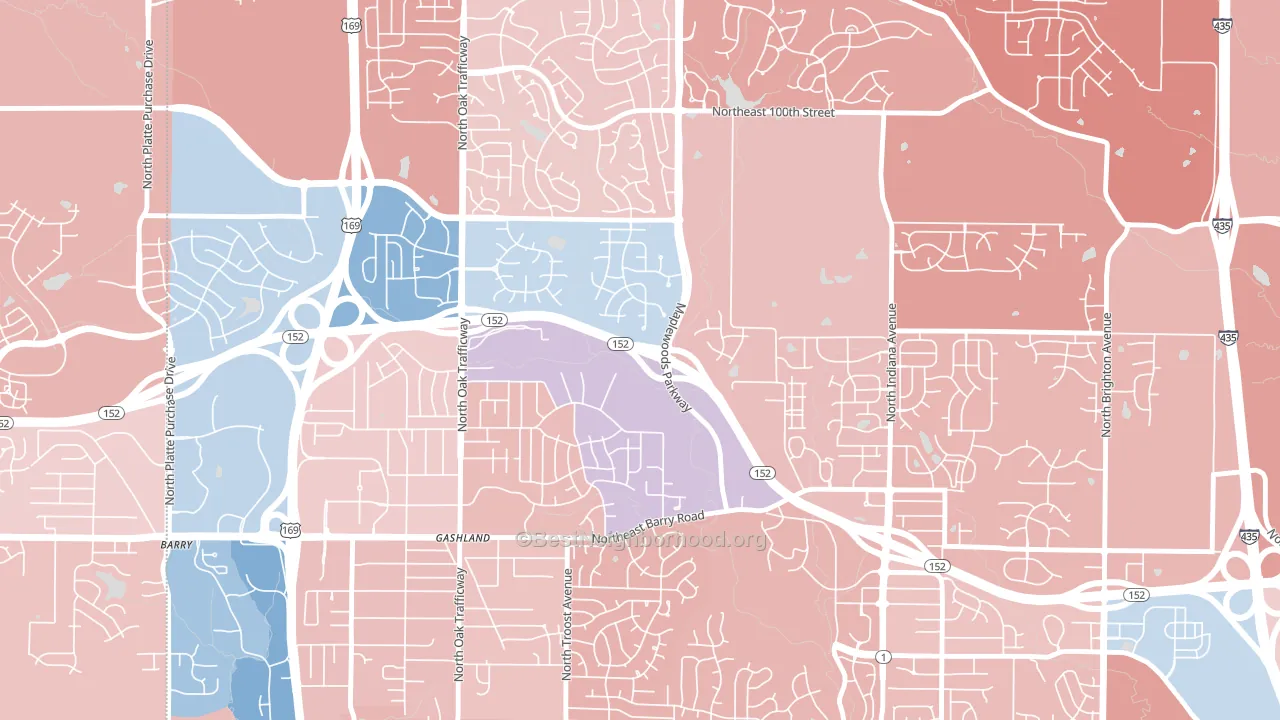
Gashland is a true toss-up. About 48% of voters here vote Democratic and 52% Republican.
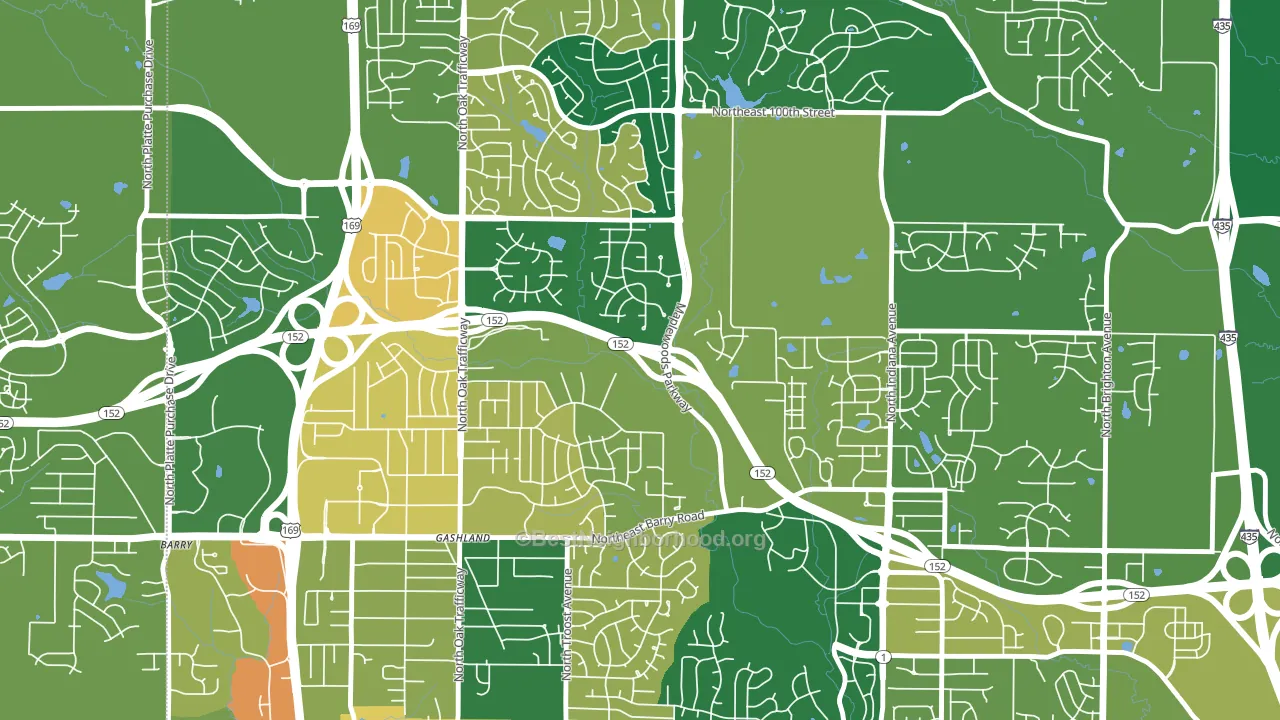
About 78% of adults in Gashland typically vote, above the U.S. average of about 62%. Among adults in Gashland, ~37% vote Democratic, ~40% Republican, and ~23% don't vote. The map below shows estimated turnout by block group.
How Gashland compares
Among neighborhoods within 5 miles, Gashland is the most Republican-leaning.
Gashland runs about 15 points more Democratic than Missouri as a whole.
Why Gashland leans the way it does
Density, race composition, education, and family structure all sit close to their national averages in Gashland. The lean here lands roughly where demographic data alone would predict.
Paved land cover and Republican lean
Places with little paved surface tend to lean Republican; Gashland, Kansas City, MO sits below the national average on this measure. Paved ground does not change how people vote; it mostly reflects how urban and built-up a place is.
Why turnout in Gashland looks the way it does
Areas with high high-school completion turn out at higher rates. About 98% of adults in Gashland have completed high school, about 9 points above the Missouri average of 89%. Learn more about the findings and methodology on the political spectrum map.
Nearby Neighborhoods
- Meadowbrook Heights, Kansas City, MO R+3
- Barry Harbour, Kansas City, MO D+13
- Clayton, Kansas City, MO D+9
- Platte Brook North, Kansas City, MO D+9
- Coves North, Kansas City, MO D+9
- The Coves, Kansas City, MO D+14
- Lakeview Terrace, Kansas City, MO D+14
- Davidson, Kansas City, MO D+11
- Breen Hills, Kansas City, MO D+7
- Parkdale-Walden, Kansas City, MO D+8
Neighborhoods with Similar Populations
- First Ward, Binghamton, NY D+29
- Armatage, Minneapolis, MN D+65
- Bailey, East Lansing, MI D+57
- Northwest Arvada, Arvada, CO D+16
- Leaksville, Eden, NC R+9
- Columbia Heghts, Arlington, VA D+61
- Kearny Mesa, San Diego, CA D+25
- North Elevation, Billings, MT D+7
- College Hill, Easton, PA D+57
- Surrey Lane, Bergenfield, NJ R+22
Sources and methodology
Precinct-level voting records used to fit the model come from Missouri Secretary of State, Elections, distributed by the Voting and Election Science Team. Demographic inputs come from the U.S. Census Bureau (ACS 5-year estimates and the 2020 Decennial Census). Health and environmental inputs come from the CDC (PLACES and the Environmental Justice Index). Land cover comes from the USGS and EPA. Election-day and lead-up weather come from PRISM 4km daily grids and the NOAA Global Historical Climatology Network. Mail-voting and election-administration patterns come from the MIT Election Lab's Survey of the Performance of American Elections. Block-group crime detail comes from CrimeGrade. Internet data and modeling support provided by ISPreports.org.
Modeling and analysis by the BestNeighborhood data science team. Full methodology and findings: political spectrum map.
Methodology reviewed by the BestNeighborhood data team. Last updated May 2026.