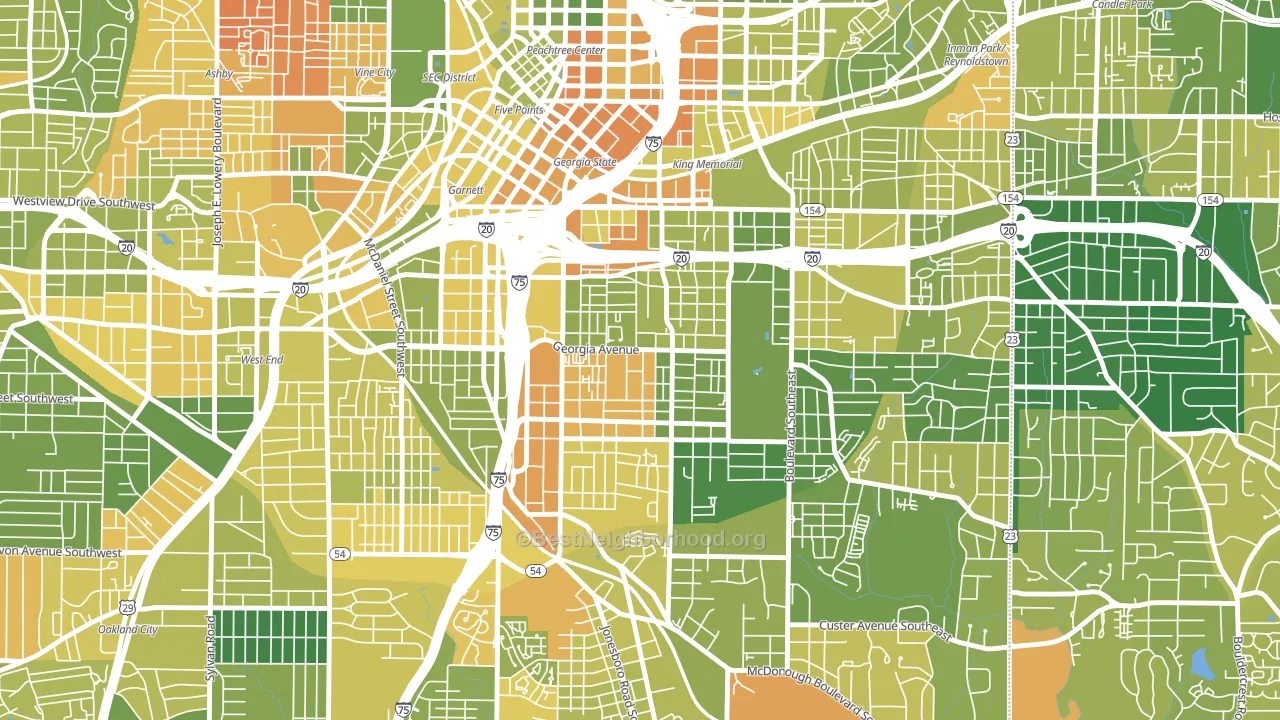
Grant Park is a Democratic stronghold. About 85% of voters here vote Democratic and 15% Republican.
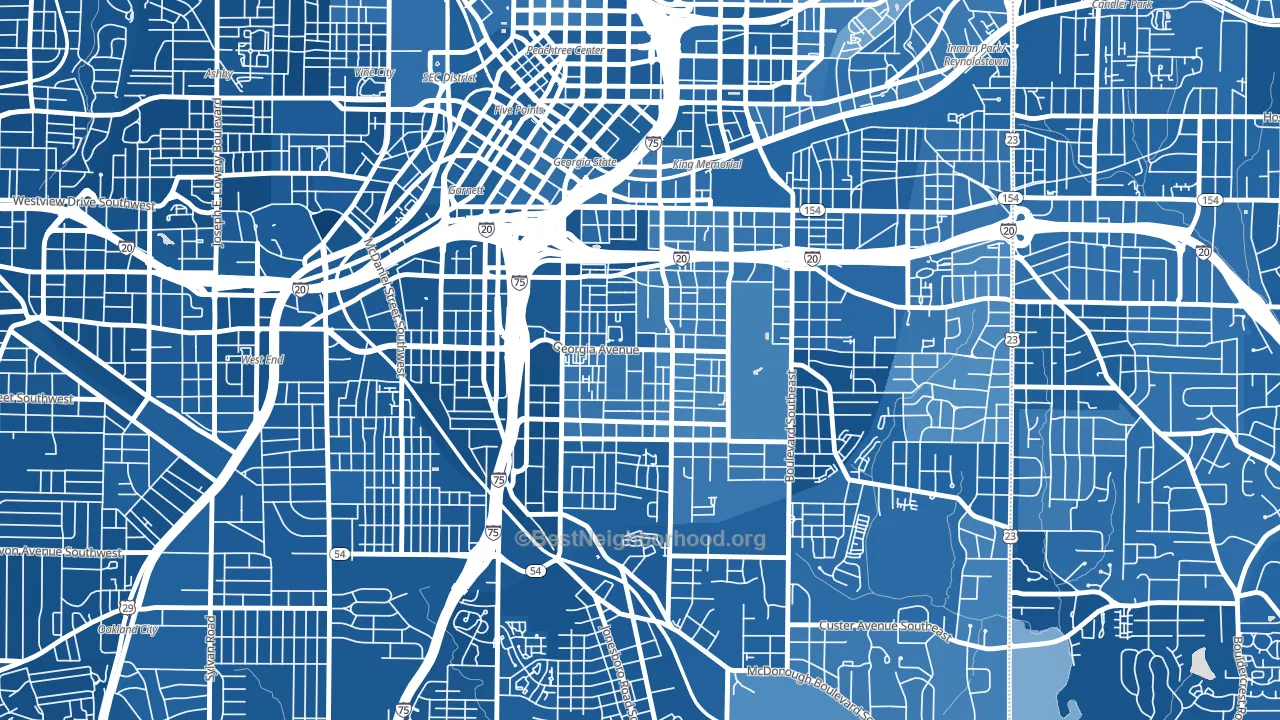
About 60% of adults in Grant Park typically vote, near the U.S. average of about 62%. Among adults in Grant Park, ~51% vote Democratic, ~9% Republican, and ~40% don't vote. The map below shows estimated turnout by block group.
How Grant Park compares
Among neighborhoods within 5 miles, Grant Park leans more Democratic than 11 of 23 neighbors.
Grant Park runs about 73 points more Democratic than Georgia as a whole. Georgia is roughly evenly split, and Grant Park sits clearly on the Democratic side.
Politics vary noticeably by block within Grant Park. The southwest side is the most Democratic-leaning (D+79) and the east side is the least Democratic-leaning (D+62), a spread of about 16 points.
Why Grant Park leans the way it does
This analysis examined 14,881 data points per neighborhood to find what predicts political lean and turnout. The items below are a few correlations that stood out for Grant Park, not a ranked or complete list of what matters most.
Dense areas vote Democratic. More than 99% of residents in Grant Park live in densely developed areas, about 64 points above the U.S. average of 36%. High college attainment predicts Democratic voting, and Grant Park sits in the top quarter (about 61%, above 82% of neighborhoods). Grant Park runs against the grain of Georgia, a Democratic-leaning outlier in a roughly evenly split state.
Walkability and Democratic lean
Places with a highly walkable street grid tend to lean Democratic; Grant Park, Atlanta, GA sits in the top quarter nationally on this measure. A walkable street grid does not change how people vote; it mostly reflects how urban a place is.
Why turnout in Grant Park looks the way it does
High-crime urban areas turn out at lower rates, mostly because the housing stress common in those areas makes voting harder. Grant Park sits in the top 15% nationally on a violent-crime measure. See CrimeGrade for more details. Learn more about the findings and methodology on the political spectrum map.
Nearby Neighborhoods
- Mechanicsville, Atlanta, GA D+80
- Cabbage Town, Atlanta, GA D+69
- Sweet Auburn, Atlanta, GA D+72
- Adair Park, Atlanta, GA D+83
- Five Points, Atlanta, GA D+76
- Thomasville, Atlanta, GA D+68
- University Center, Atlanta, GA D+88
- Old Fourth Ward, Atlanta, GA D+59
- Atlanta-Inman Park, Atlanta, GA D+56
- Ormewood Park-East Atlanta, Atlanta, GA D+67
Neighborhoods with Similar Populations
- Starcrest, Salmon Creek, WA D+18
- Estlake Greens, Chula Vista, CA D+17
- Conway, Orlando, FL R+4
- Driftwood, Hollywood, FL D+6
- Lakewood Village, Long Beach, CA D+24
- Madison Village, Lakewood, OH D+41
- Central Davis, Davis, CA D+72
- Mid-Cambridge, Cambridge, MA D+77
- Mann, Iowa City, IA D+51
- Village 2, Sacramento, CA D+27
Sources and methodology
Precinct-level voting records used to fit the model come from Georgia Elections Division, distributed by the Voting and Election Science Team. Demographic inputs come from the U.S. Census Bureau (ACS 5-year estimates and the 2020 Decennial Census). Health and environmental inputs come from the CDC (PLACES and the Environmental Justice Index). Land cover comes from the USGS and EPA. Election-day and lead-up weather come from PRISM 4km daily grids and the NOAA Global Historical Climatology Network. Mail-voting and election-administration patterns come from the MIT Election Lab's Survey of the Performance of American Elections. Block-group crime detail comes from CrimeGrade. Internet data and modeling support provided by ISPreports.org.
Modeling and analysis by the BestNeighborhood data science team. Full methodology and findings: political spectrum map.
Methodology reviewed by the BestNeighborhood data team. Last updated May 2026.