Estlake Greens leans Democratic by roughly 16 points: about 58% of voters vote Democratic and 42% Republican.
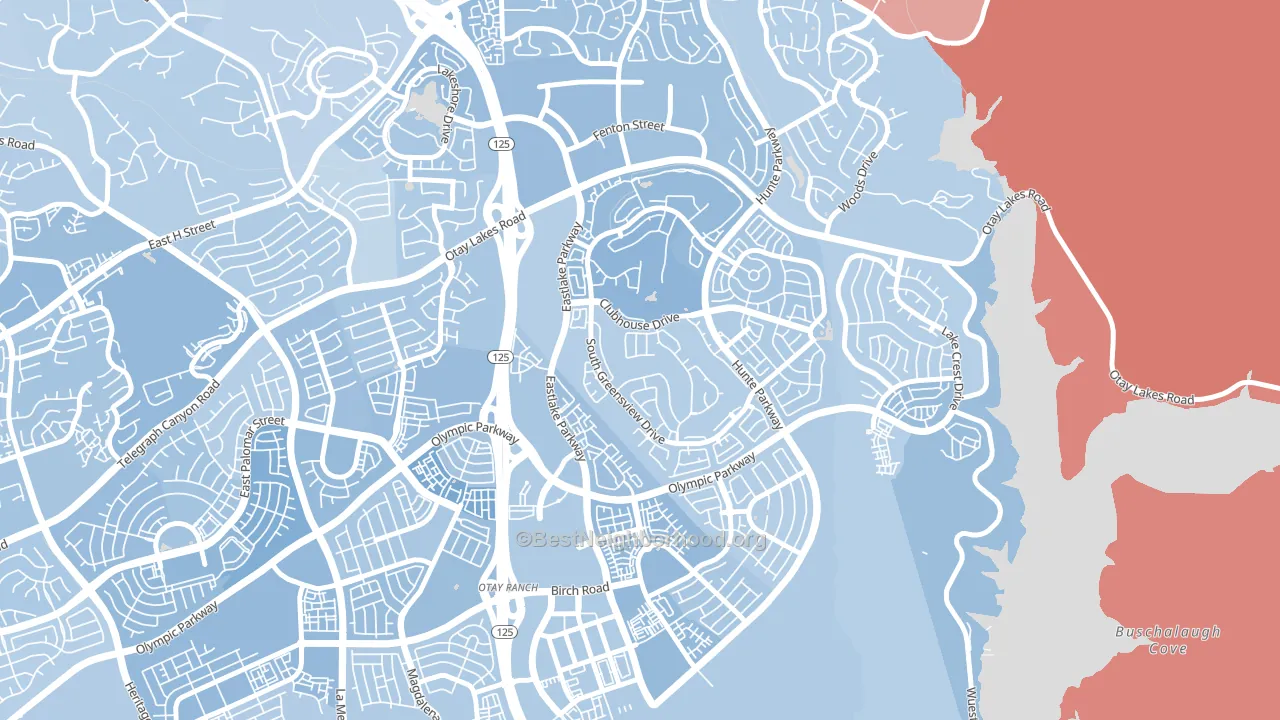
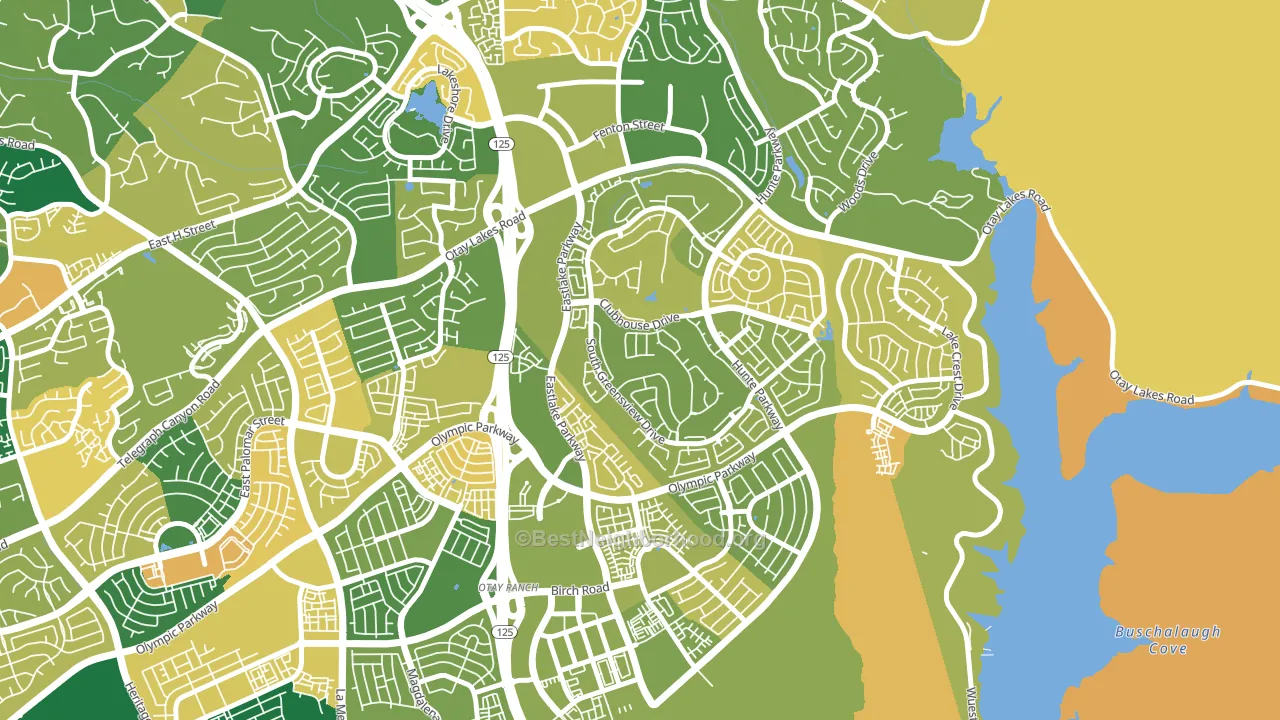
About 70% of adults in Estlake Greens typically vote, above the U.S. average of about 62%. Among adults in Estlake Greens, ~41% vote Democratic, ~30% Republican, and ~29% don't vote. The map below shows estimated turnout by block group.
How Estlake Greens compares
Among neighborhoods within 5 miles, Estlake Greens leans more Democratic than 10 of 12 neighbors.
Politically, Estlake Greens sits close to the rest of California.
Why Estlake Greens leans the way it does
This analysis examined 14,881 data points per neighborhood to find what predicts political lean and turnout. The items below are a few correlations that stood out for Estlake Greens, not a ranked or complete list of what matters most.
Density combined with diversity predicts Democratic voting. Non-Hispanic white share in Estlake Greens is about 20%, about 52 points below the U.S. average of 72%.
Park access and Democratic lean
Places with heavy park coverage tend to lean Democratic; Estlake Greens, Chula Vista, CA sits in the top quarter nationally on this measure. Park access does not change how people vote; it tends to track denser, higher-income areas.
Why turnout in Estlake Greens looks the way it does
Turnout in Estlake Greens sits close to the national pattern. Routine healthcare access, homeownership, education, and food security all land near their national averages here. Learn more about the findings and methodology on the political spectrum map.
Nearby Neighborhoods
- Eastlake Trails, Chula Vista, CA D+15
- Eastlake Vistas, Chula Vista, CA D+19
- Otay Ranch, Chula Vista, CA D+16
- East Lake, Chula Vista, CA D+16
- Rolling Hills Ranch, Chula Vista, CA D+9
- San Miguel Ranch, Chula Vista, CA D+11
- Bonita Long Canyon, Bonita, CA D+7
- Paseo Ranchoero, Chula Vista, CA D+16
- Rancho del Rey, Chula Vista, CA D+15
- Sunbow, Chula Vista, CA D+18
Neighborhoods with Similar Populations
- Starcrest, Salmon Creek, WA D+18
- Grant Park, Atlanta, GA D+71
- Driftwood, Hollywood, FL D+6
- Lakewood Village, Long Beach, CA D+24
- Conway, Orlando, FL R+4
- Mid-Cambridge, Cambridge, MA D+77
- Madison Village, Lakewood, OH D+41
- Central Davis, Davis, CA D+72
- Independence Heights, Houston, TX D+53
- Mann, Iowa City, IA D+51
Sources and methodology
Precinct-level voting records used to fit the model come from California Secretary of State, Elections, distributed by the Voting and Election Science Team. Demographic inputs come from the U.S. Census Bureau (ACS 5-year estimates and the 2020 Decennial Census). Health and environmental inputs come from the CDC (PLACES and the Environmental Justice Index). Land cover comes from the USGS and EPA. Election-day and lead-up weather come from PRISM 4km daily grids and the NOAA Global Historical Climatology Network. Mail-voting and election-administration patterns come from the MIT Election Lab's Survey of the Performance of American Elections. Block-group crime detail comes from CrimeGrade. Internet data and modeling support provided by ISPreports.org.
Modeling and analysis by the BestNeighborhood data science team. Full methodology and findings: political spectrum map.
Methodology reviewed by the BestNeighborhood data team. Last updated May 2026.