Haines Borough leans Republican by roughly 16 points: about 42% of voters vote Democratic and 58% Republican. These figures are model estimates: Alaska did not have precinct-level voting records available for training, so the numbers above come from demographic and health features rather than local ground truth.
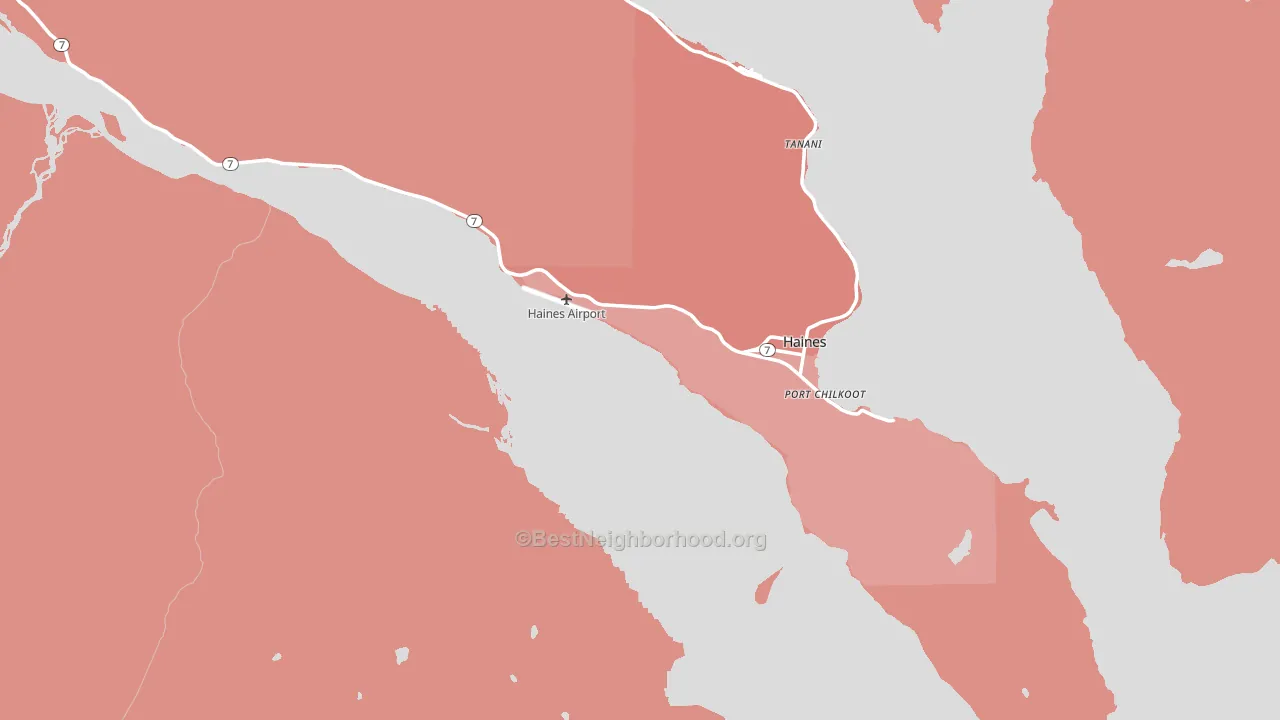
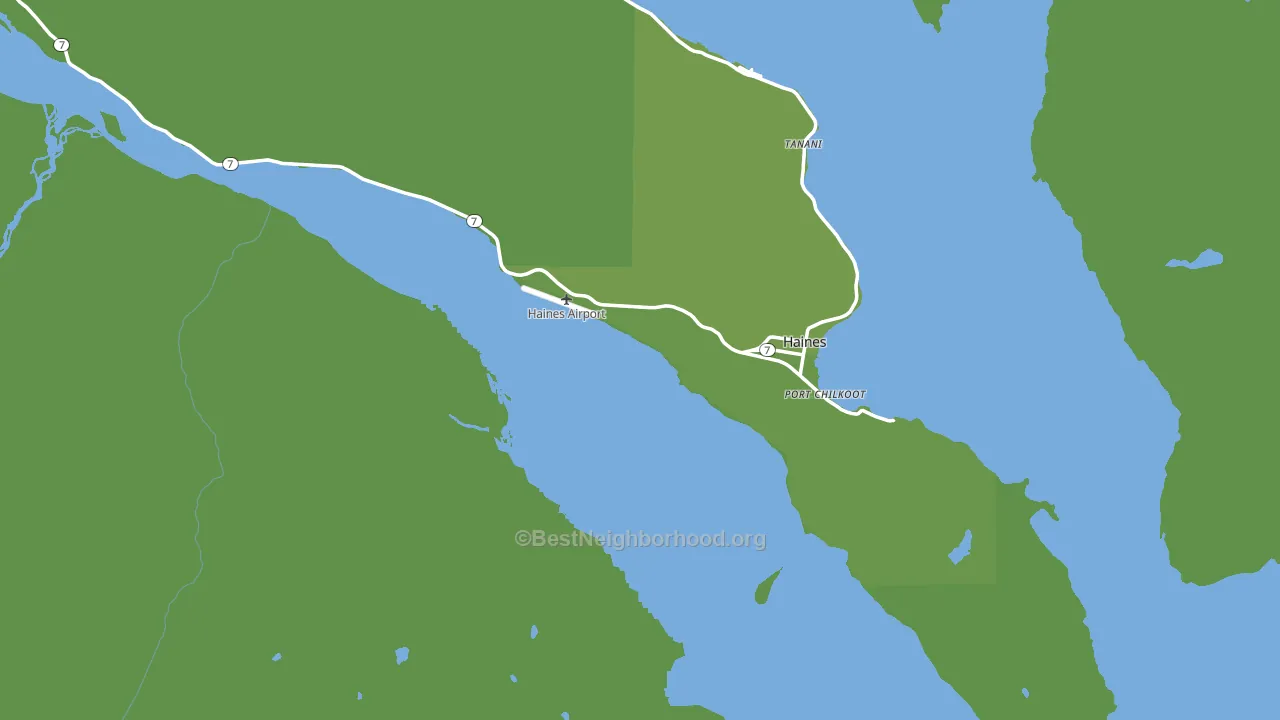
About 76% of adults in Haines Borough typically vote, above the U.S. average of about 62%. Among adults in Haines Borough, ~32% vote Democratic, ~44% Republican, and ~24% don't vote. The map below shows estimated turnout by block group.
How Haines Borough compares
Politically, Haines Borough sits close to the rest of Alaska.
Why Haines Borough leans the way it does
Density, race composition, education, and family structure all sit close to their national averages in Haines Borough. None of them point strongly toward either party.
Population density and Republican lean
Places with low population density tend to lean Republican; Haines Borough, AK sits in the bottom quarter nationally on this measure.
Why turnout in Haines Borough looks the way it does
Areas with high high-school completion turn out at higher rates. About 98% of adults in Haines Borough have completed high school, about 9 points above the Alaska average of 89%. Learn more about the findings and methodology on the political spectrum map.
Nearby Counties
- Skagway Municipality, AK R+23
- Juneau City and Borough, AK D+22
- Hoonah-Angoon Census Area, AK Even
- Yakutat City and Borough, AK Even
- Sitka City and Borough, AK D+13
- Petersburg Census Area, AK R+4
- Wrangell City and Borough, AK R+8
- Prince of Wales-Hyder Census Area, AK R+18
- Ketchikan Gateway Borough, AK R+3
- Southeast Fairbanks Census Area, AK R+39
Counties with Similar Populations
- Stanton County, KS R+48
- Wheatland County, MT R+66
- Keweenaw County, MI Even
- Faulk County, SD R+66
- Wrangell City and Borough, AK R+8
- Judith Basin County, MT R+62
- Wichita County, KS R+59
- Towner County, ND R+45
- Jeff Davis County, TX R+51
- Gilliam County, OR R+48
Sources and methodology
Precinct-level voting records used to fit the model come from Alaska Division of Elections, distributed by the Voting and Election Science Team. Demographic inputs come from the U.S. Census Bureau (ACS 5-year estimates and the 2020 Decennial Census). Health and environmental inputs come from the CDC (PLACES and the Environmental Justice Index). Land cover comes from the USGS and EPA. Election-day and lead-up weather come from PRISM 4km daily grids and the NOAA Global Historical Climatology Network. Mail-voting and election-administration patterns come from the MIT Election Lab's Survey of the Performance of American Elections. Block-group crime detail comes from CrimeGrade. Internet data and modeling support provided by ISPreports.org.
Modeling and analysis by the BestNeighborhood data science team. AK did not have precinct-level voting records available for training, so the figures here come from extrapolation across demographic, health, and land-use features rather than local ground truth. Full methodology and findings: political spectrum map.
Methodology reviewed by the BestNeighborhood data team. Last updated May 2026.