Hamlin Park is a Democratic stronghold. About 90% of voters here vote Democratic and 10% Republican.
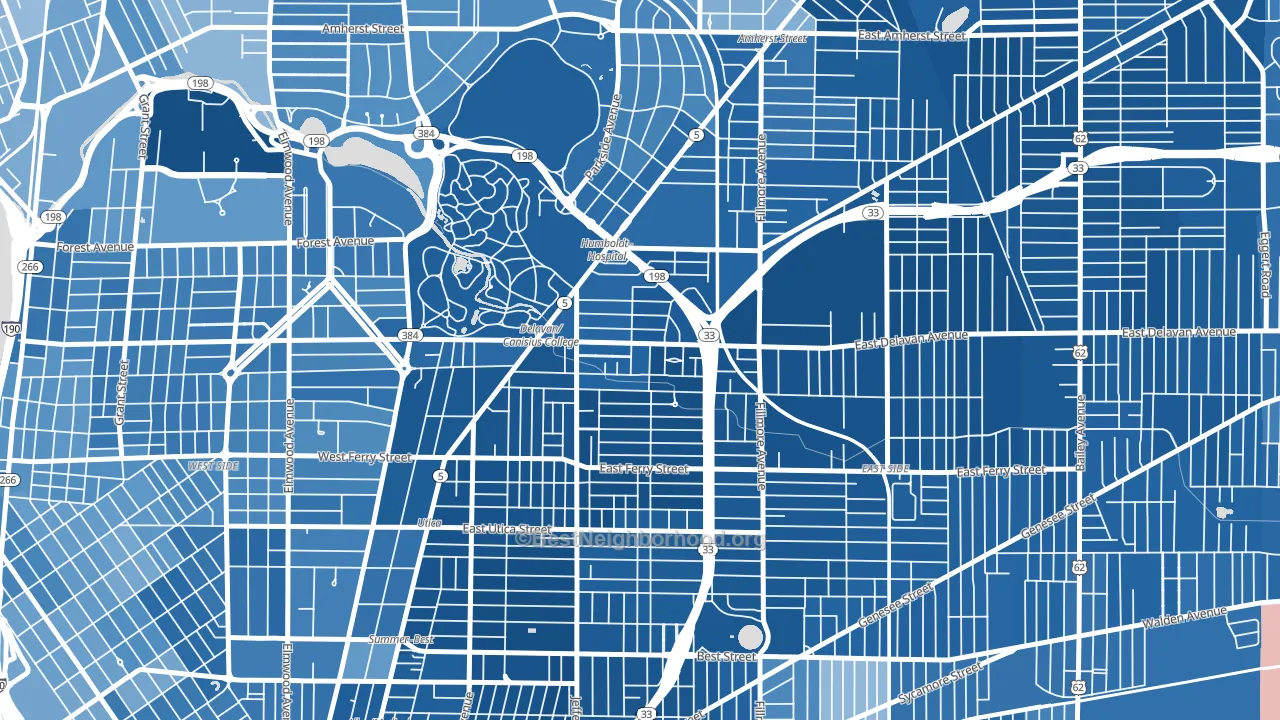
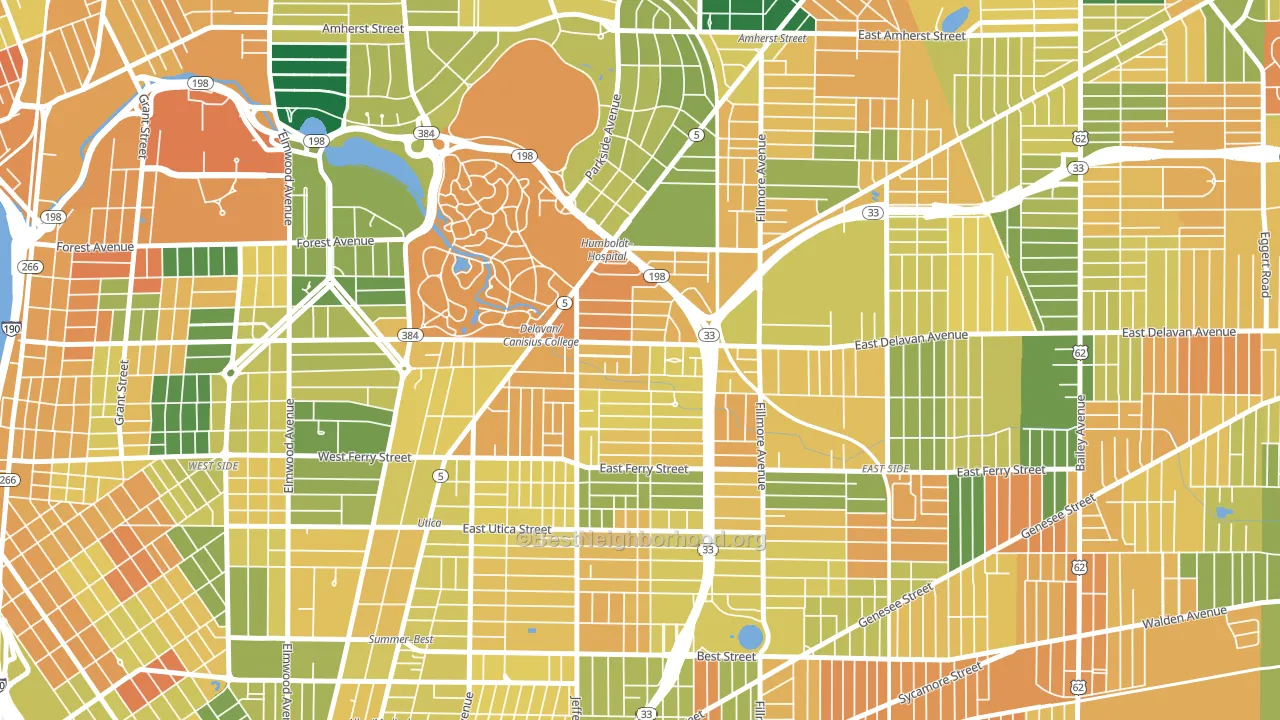
About 41% of adults in Hamlin Park typically vote, below the U.S. average of about 62%. Among adults in Hamlin Park, ~37% vote Democratic, ~4% Republican, and ~59% don't vote. The map below shows estimated turnout by block group.
How Hamlin Park compares
Among neighborhoods within 5 miles, Hamlin Park leans more Democratic than 31 of 34 neighbors.
Hamlin Park runs about 67 points more Democratic than New York as a whole.
Politics vary noticeably by block within Hamlin Park. The southwest side is the most Democratic-leaning (D+86) and the west side is the least Democratic-leaning (D+70), a spread of about 15 points.
Why Hamlin Park leans the way it does
This analysis examined 14,881 data points per neighborhood to find what predicts political lean and turnout. The items below are a few correlations that stood out for Hamlin Park, not a ranked or complete list of what matters most.
Dense areas vote Democratic. More than 99% of residents in Hamlin Park live in densely developed areas, about 64 points above the U.S. average of 36%. A high never-married share predicts Democratic voting, and about 57% of adults in Hamlin Park have never been married, above 90% of neighborhoods.
Never-married share, developed land, and voter turnout
Places that combine a never-married-heavy adult population and a heavily developed built environment tend to turn out at a lower rate, as Hamlin Park, Buffalo, NY does.
Why turnout in Hamlin Park looks the way it does
High-crime urban areas turn out at lower rates, mostly because the housing stress common in those areas makes voting harder. Hamlin Park sits in the top 15% nationally on a violent-crime measure. See CrimeGrade for more details. Low high-school completion lines up with lower turnout, and about 86% of adults in Hamlin Park have completed high school, below 74% of neighborhoods. Learn more about the findings and methodology on the political spectrum map.
Nearby Neighborhoods
- Kingsley, Buffalo, NY D+84
- Grider, Buffalo, NY D+82
- Mlk Park, Buffalo, NY D+79
- Delaware-West Ferry, Buffalo, NY D+67
- Leroy, Buffalo, NY D+73
- Albright, Buffalo, NY D+59
- Genesee Moselle, Buffalo, NY D+70
- Park Meadow, Buffalo, NY D+57
- Bryant, Buffalo, NY D+68
- Broadway-Fillmore, Buffalo, NY D+47
Neighborhoods with Similar Populations
- North Whisman, Mountain View, CA D+39
- Hartwell, Cincinnati, OH D+40
- Wayland, Providence, RI D+40
- Near North, Minneapolis, MN D+70
- Foxcroft, Charlotte, NC D+7
- Fox Hills, Culver City, CA D+54
- East Erie, Erie, PA D+47
- Pecan Valley, San Antonio, TX D+26
- Lake Aumond, Augusta, GA D+25
- Farm Pond, Charlotte, NC D+49
Sources and methodology
Precinct-level voting records used to fit the model come from New York State Board of Elections, distributed by the Voting and Election Science Team. Demographic inputs come from the U.S. Census Bureau (ACS 5-year estimates and the 2020 Decennial Census). Health and environmental inputs come from the CDC (PLACES and the Environmental Justice Index). Land cover comes from the USGS and EPA. Election-day and lead-up weather come from PRISM 4km daily grids and the NOAA Global Historical Climatology Network. Mail-voting and election-administration patterns come from the MIT Election Lab's Survey of the Performance of American Elections. Block-group crime detail comes from CrimeGrade. Internet data and modeling support provided by ISPreports.org.
Modeling and analysis by the BestNeighborhood data science team. Full methodology and findings: political spectrum map.
Methodology reviewed by the BestNeighborhood data team. Last updated May 2026.