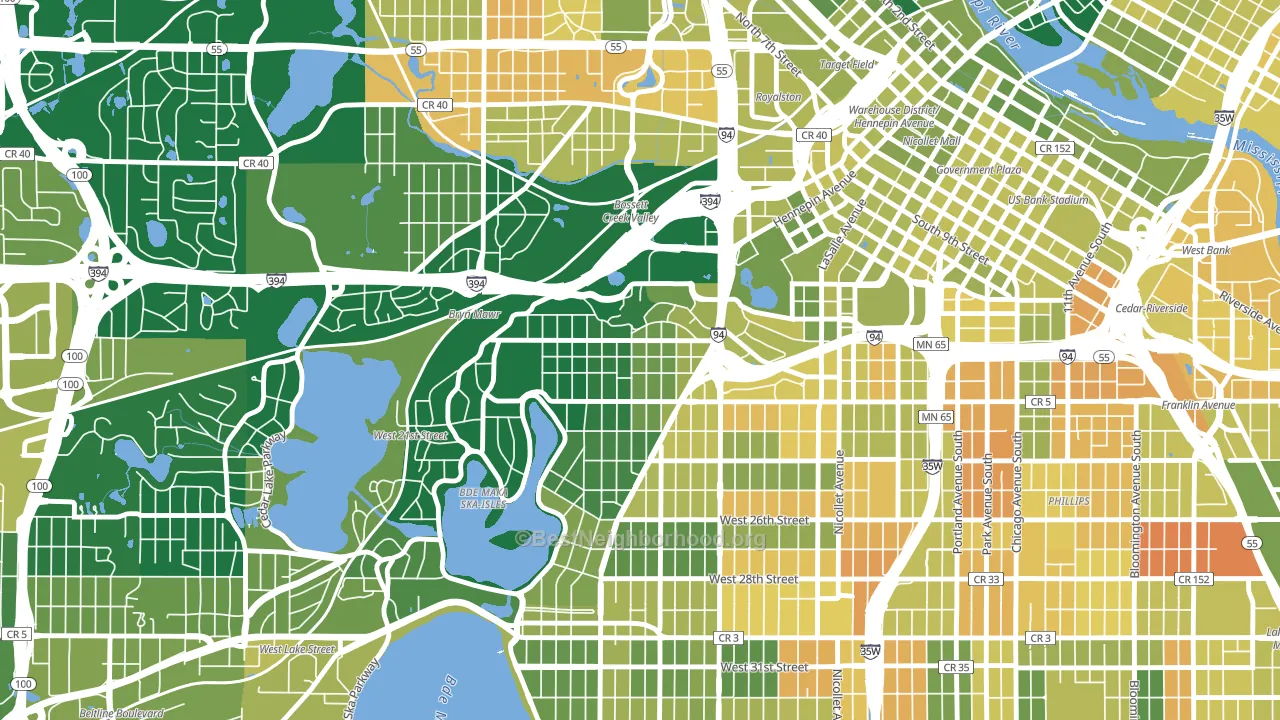
Lowry Hill is a Democratic stronghold. About 87% of voters here vote Democratic and 13% Republican.
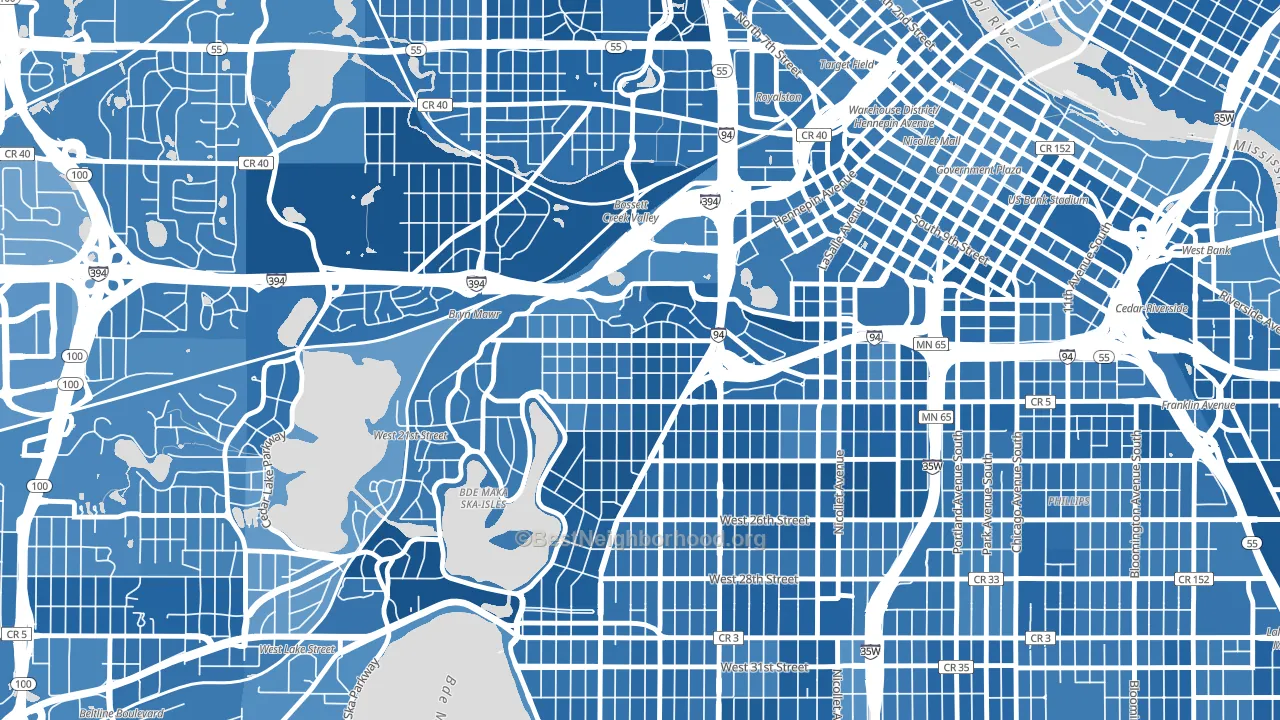
About 87% of adults in Lowry Hill typically vote, above the U.S. average of about 62%. Among adults in Lowry Hill, ~76% vote Democratic, ~11% Republican, and ~13% don't vote. The map below shows estimated turnout by block group.
How Lowry Hill compares
Among neighborhoods within 5 miles, Lowry Hill leans more Democratic than 42 of 56 neighbors.
Lowry Hill runs about 69 points more Democratic than Minnesota as a whole.
Why Lowry Hill leans the way it does
This analysis examined 14,881 data points per neighborhood to find what predicts political lean and turnout. The items below are a few correlations that stood out for Lowry Hill, not a ranked or complete list of what matters most.
Areas with high college attainment vote Democratic. About 74% of adults in Lowry Hill hold a bachelor's degree, about 46 points above the U.S. average of 28%.
Walkability and Democratic lean
Places with a highly walkable street grid tend to lean Democratic; Lowry Hill, Minneapolis, MN sits in the top quarter nationally on this measure. A walkable street grid does not change how people vote; it mostly reflects how urban a place is.
Why turnout in Lowry Hill looks the way it does
Areas with strong routine healthcare access turn out at higher rates. Lowry Hill is in the top quarter nationally for routine-care measures such as insurance coverage, preventive screenings, and dental visits. The dental-visit rate here is about 78%, about 18 points above the U.S. average of 60%. High high-school completion lines up with higher turnout, and more than 99% of adults in Lowry Hill have completed high school, above 92% of neighborhoods. Learn more about the findings and methodology on the political spectrum map.
Nearby Neighborhoods
- Loring Park, Minneapolis, MN D+69
- Lowry Hill East, Minneapolis, MN D+75
- East Isles, Minneapolis, MN D+81
- Stevens Square, Minneapolis, MN D+71
- Whittier, Minneapolis, MN D+72
- Harrison, Minneapolis, MN D+67
- Phillips West, Minneapolis, MN D+54
- Calhoun, Minneapolis, MN D+74
- Elliot Park, Minneapolis, MN D+63
- Downtown West, Minneapolis, MN D+61
Neighborhoods with Similar Populations
- Madison-Eastend, Baltimore, MD D+85
- Walnut Creek, Pembroke Pines, FL D+18
- Creighton, Richmond, VA D+84
- Barcroft, Arlington, VA D+48
- North Meadow Brook, Norfolk, VA D+29
- Rittersville, Allentown, PA D+10
- Brandywine, Oklahoma City, OK R+26
- Old Town Manchester, Richmond, VA D+64
- Leisureville, Boynton Beach, FL Even
- Beulah Heights, Pueblo, CO D+10
Sources and methodology
Precinct-level voting records used to fit the model come from Minnesota Secretary of State, Elections, distributed by the Voting and Election Science Team. Demographic inputs come from the U.S. Census Bureau (ACS 5-year estimates and the 2020 Decennial Census). Health and environmental inputs come from the CDC (PLACES and the Environmental Justice Index). Land cover comes from the USGS and EPA. Election-day and lead-up weather come from PRISM 4km daily grids and the NOAA Global Historical Climatology Network. Mail-voting and election-administration patterns come from the MIT Election Lab's Survey of the Performance of American Elections. Block-group crime detail comes from CrimeGrade. Internet data and modeling support provided by ISPreports.org.
Modeling and analysis by the BestNeighborhood data science team. Full methodology and findings: political spectrum map.
Methodology reviewed by the BestNeighborhood data team. Last updated May 2026.