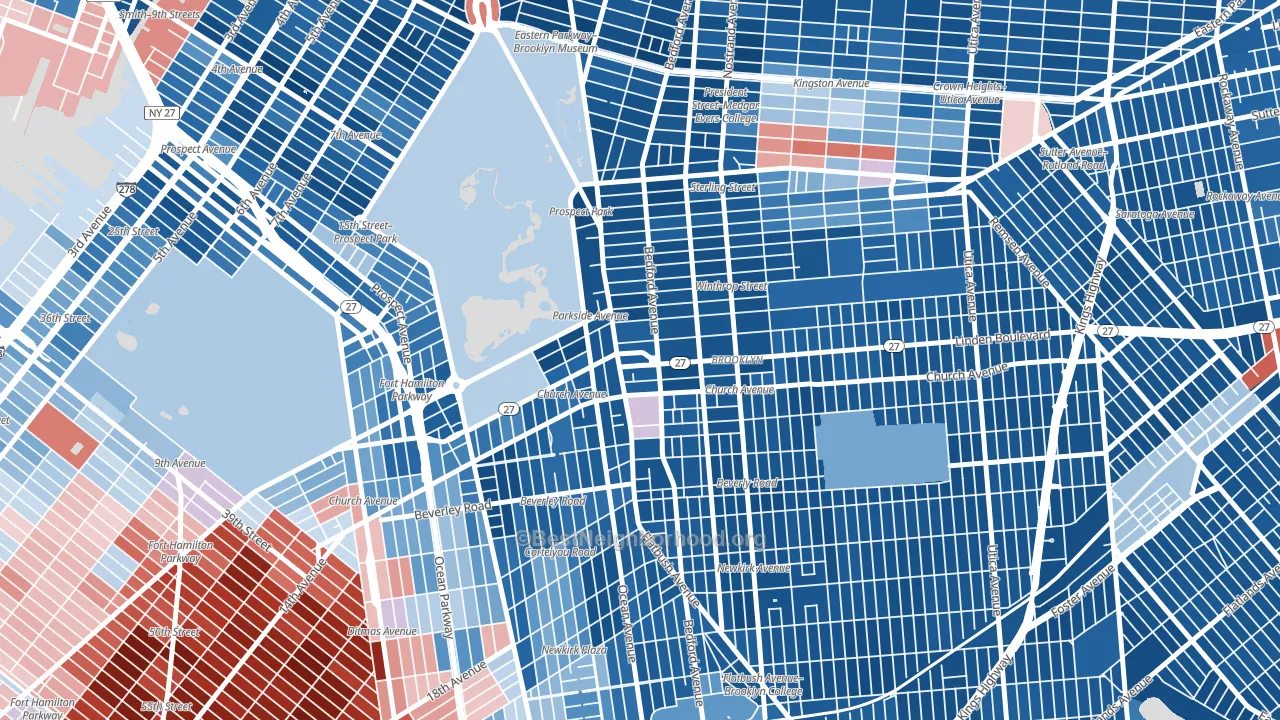
Prospect Lefferts Gardens is a Democratic stronghold. About 92% of voters here vote Democratic and 8% Republican.
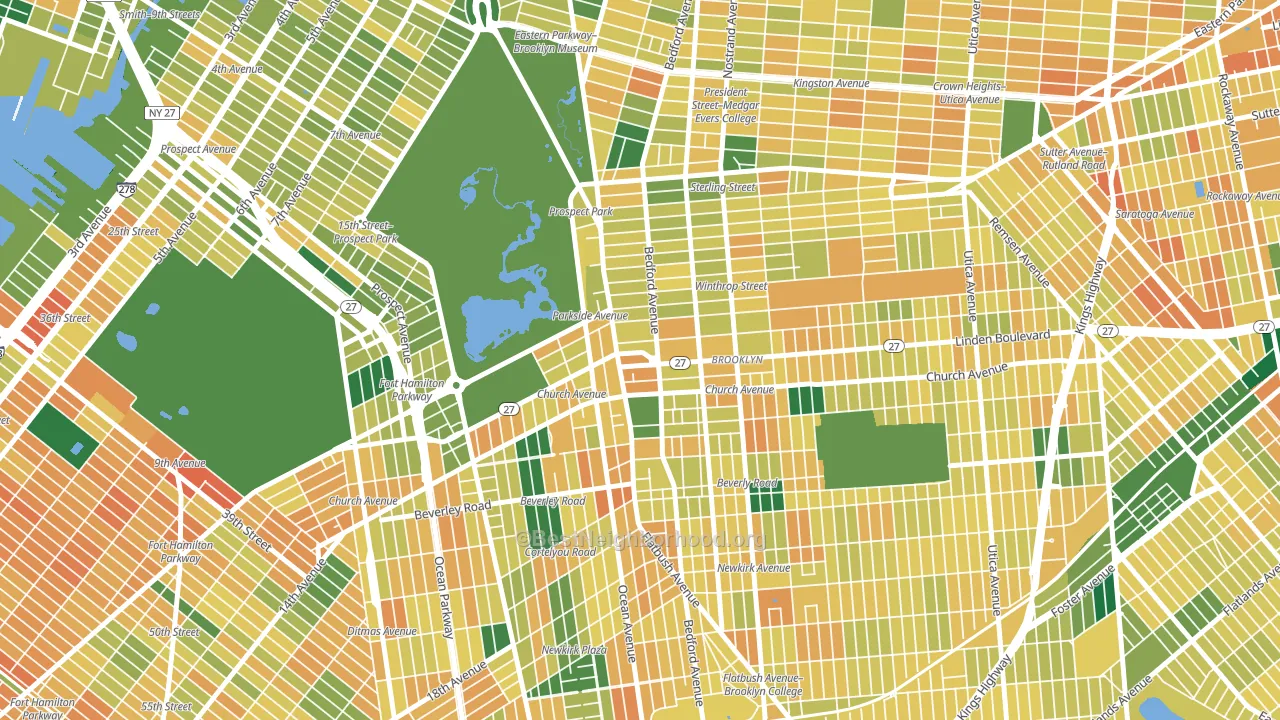
About 52% of adults in Prospect Lefferts Gardens typically vote, below the U.S. average of about 62%. Among adults in Prospect Lefferts Gardens, ~48% vote Democratic, ~4% Republican, and ~48% don't vote. The map below shows estimated turnout by block group.
How Prospect Lefferts Gardens compares
Among neighborhoods within 5 miles, Prospect Lefferts Gardens is the most Democratic-leaning.
Prospect Lefferts Gardens runs about 72 points more Democratic than New York as a whole.
Why Prospect Lefferts Gardens leans the way it does
This analysis examined 14,881 data points per neighborhood to find what predicts political lean and turnout. The items below are a few correlations that stood out for Prospect Lefferts Gardens, not a ranked or complete list of what matters most.
Density combined with diversity predicts Democratic voting. Non-Hispanic white share in Prospect Lefferts Gardens is about 14%, about 58 points below the U.S. average of 72%. A high never-married share predicts Democratic voting, and about 52% of adults in Prospect Lefferts Gardens have never been married, above 84% of neighborhoods.
Walkability and Democratic lean
Places with a highly walkable street grid tend to lean Democratic; Prospect Lefferts Gardens, Brooklyn, NY sits in the top quarter nationally on this measure. A walkable street grid does not change how people vote; it mostly reflects how urban a place is.
Why turnout in Prospect Lefferts Gardens looks the way it does
Renters vote less often than owners. About 82% of households in Prospect Lefferts Gardens rent, about 57 points above the U.S. average of 25%. High-crime urban areas turn out at lower rates, and Prospect Lefferts Gardens sits in the top 15% on a violent-crime measure. Learn more about the findings and methodology on the political spectrum map.
Nearby Neighborhoods
- Flatbush-Ditmas Park, Brooklyn, NY D+84
- Ditmas Park, Brooklyn, NY D+69
- Crown Heights, Brooklyn, NY D+59
- East Flatbush, Brooklyn, NY D+81
- Park Slope, Brooklyn, NY D+78
- Mapleton-Flatlands, Brooklyn, NY D+4
- Borough Park, Brooklyn, NY R+33
- Greenwood, Brooklyn, NY D+62
- Fort Green, Brooklyn, NY D+78
- Bedford-Stuyvesant, Brooklyn, NY D+77
Neighborhoods with Similar Populations
- Historic Mitchell Street, Milwaukee, WI D+43
- Mission Grove, Riverside, CA Even
- North Arroyo, Pasadena, CA D+41
- North End, Fall River, MA D+4
- Willowbrook, Houston, TX D+28
- Elk Plain, Spanaway, WA R+13
- Saint Anthony, St. Paul, MN D+73
- Old Louisville, Louisville, KY D+66
- Memorial Park, Santa Ana, CA D+31
- Main Middle, Worcester, MA D+31
Sources and methodology
Precinct-level voting records used to fit the model come from New York State Board of Elections, distributed by the Voting and Election Science Team. Demographic inputs come from the U.S. Census Bureau (ACS 5-year estimates and the 2020 Decennial Census). Health and environmental inputs come from the CDC (PLACES and the Environmental Justice Index). Land cover comes from the USGS and EPA. Election-day and lead-up weather come from PRISM 4km daily grids and the NOAA Global Historical Climatology Network. Mail-voting and election-administration patterns come from the MIT Election Lab's Survey of the Performance of American Elections. Block-group crime detail comes from CrimeGrade. Internet data and modeling support provided by ISPreports.org.
Modeling and analysis by the BestNeighborhood data science team. Full methodology and findings: political spectrum map.
Methodology reviewed by the BestNeighborhood data team. Last updated May 2026.