Moreno Mission leans heavily Democratic by roughly 40 points: about 70% of voters vote Democratic and 30% Republican.
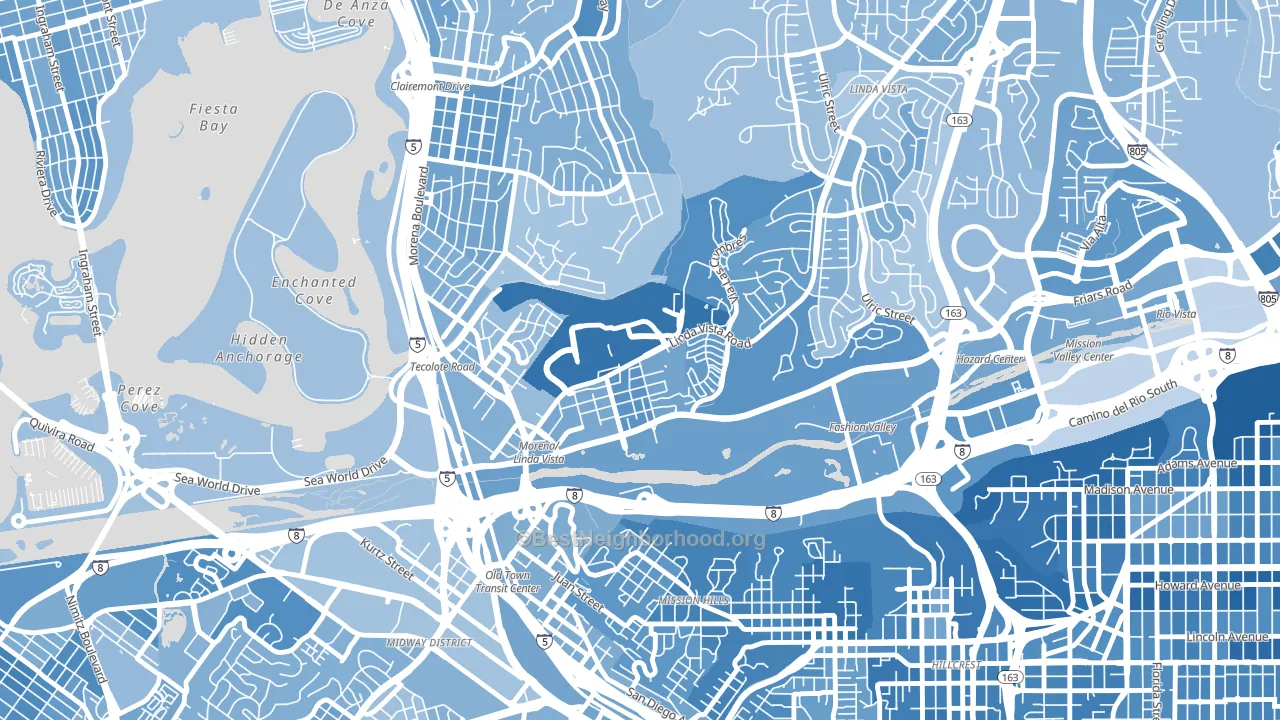
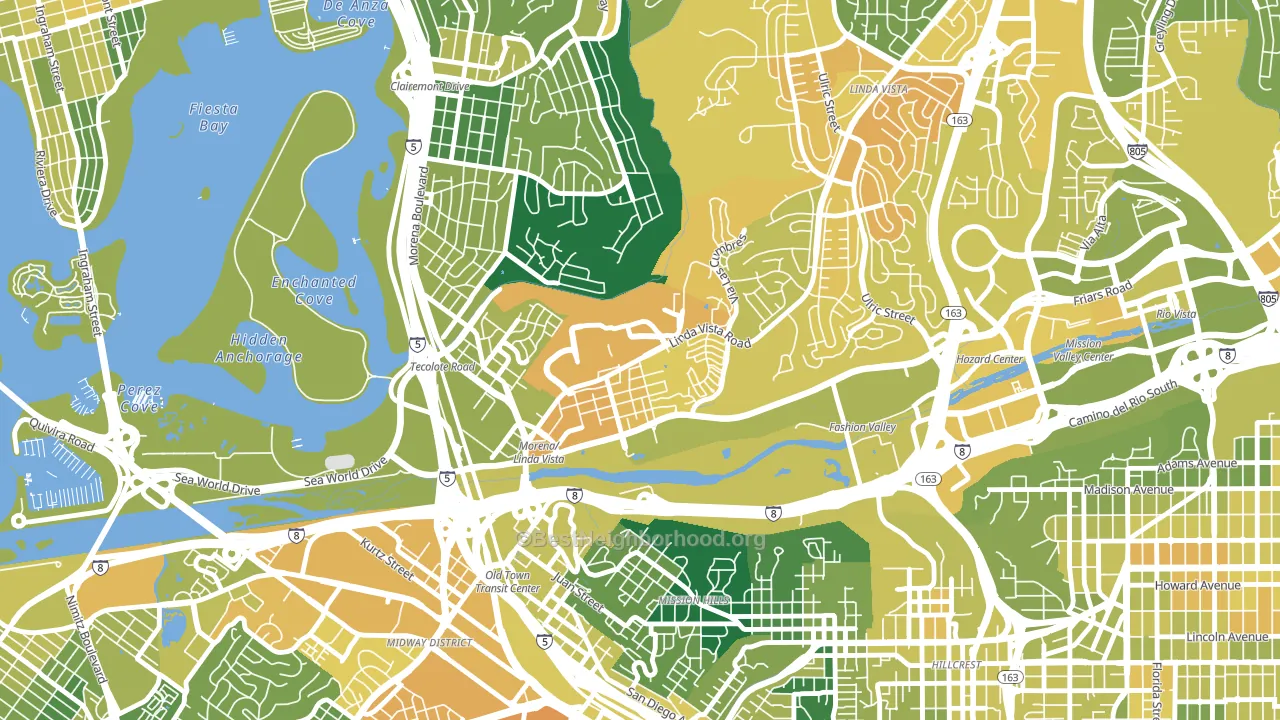
About 46% of adults in Moreno Mission typically vote, below the U.S. average of about 62%. Among adults in Moreno Mission, ~32% vote Democratic, ~14% Republican, and ~54% don't vote. The map below shows estimated turnout by block group.
How Moreno Mission compares
Among neighborhoods within 5 miles, Moreno Mission leans more Democratic than 14 of 32 neighbors.
Moreno Mission runs about 20 points more Democratic than California as a whole.
Politics vary noticeably by block within Moreno Mission. The northeast side is the most Democratic-leaning (D+44) and the northwest side is the least Democratic-leaning (D+30), a spread of about 14 points.
Why Moreno Mission leans the way it does
This analysis examined 14,881 data points per neighborhood to find what predicts political lean and turnout. The items below are a few correlations that stood out for Moreno Mission, not a ranked or complete list of what matters most.
Areas with many never-married adults vote Democratic. About 76% of adults in Moreno Mission have never been married, well above similar-sized neighborhoods (around 50%). High college attainment predicts Democratic voting, and Moreno Mission sits in the top quarter (about 58%, above 79% of neighborhoods).
Walkability and Democratic lean
Places with a highly walkable street grid tend to lean Democratic; Moreno Mission, San Diego, CA sits in the top tenth nationally on this measure. A walkable street grid does not change how people vote; it mostly reflects how urban a place is.
Why turnout in Moreno Mission looks the way it does
Renters vote less often than owners. About 77% of households in Moreno Mission rent, about 52 points above the U.S. average of 25%. Learn more about the findings and methodology on the political spectrum map.
Nearby Neighborhoods
- Linda Vista, San Diego, CA D+28
- Mission Hills-San Diego, San Diego, CA D+42
- Bay Park, San Diego, CA D+30
- Middletown, San Diego, CA D+47
- Hillcrest, San Diego, CA D+61
- Bird Land, San Diego, CA D+32
- Mission Valley East, San Diego, CA D+33
- Midtown District, San Diego, CA D+32
- University Heights, San Diego, CA D+63
- Loma Portal, San Diego, CA D+38
Neighborhoods with Similar Populations
- City College Area, Long Beach, CA D+18
- Corbett-Terwilliger-Lair Hill, Portland, OR D+68
- Lakeview-Bakersfield, Bakersfield, CA D+25
- Indiana University, Bloomington, IN D+60
- Riverside, Baltimore, MD D+64
- East Raleigh, Raleigh, NC D+64
- Jordan, Minneapolis, MN D+63
- Claytown, Detroit, MI D+16
- Greater Gardendale, San Antonio, TX D+29
- Merle Hay, Des Moines, IA D+24
Sources and methodology
Precinct-level voting records used to fit the model come from California Secretary of State, Elections, distributed by the Voting and Election Science Team. Demographic inputs come from the U.S. Census Bureau (ACS 5-year estimates and the 2020 Decennial Census). Health and environmental inputs come from the CDC (PLACES and the Environmental Justice Index). Land cover comes from the USGS and EPA. Election-day and lead-up weather come from PRISM 4km daily grids and the NOAA Global Historical Climatology Network. Mail-voting and election-administration patterns come from the MIT Election Lab's Survey of the Performance of American Elections. Block-group crime detail comes from CrimeGrade. Internet data and modeling support provided by ISPreports.org.
Modeling and analysis by the BestNeighborhood data science team. Full methodology and findings: political spectrum map.
Methodology reviewed by the BestNeighborhood data team. Last updated May 2026.