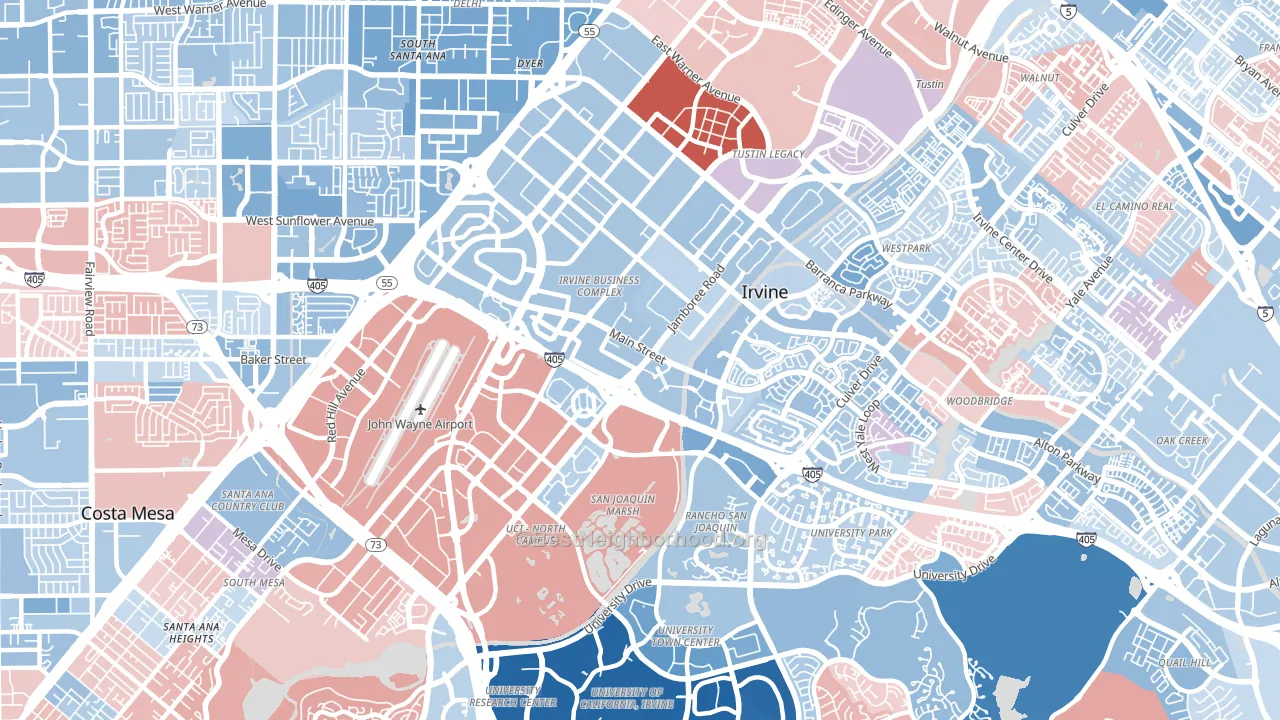
Irvine Business Complex leans slightly Democratic by roughly 10 points: about 55% of voters vote Democratic and 45% Republican.
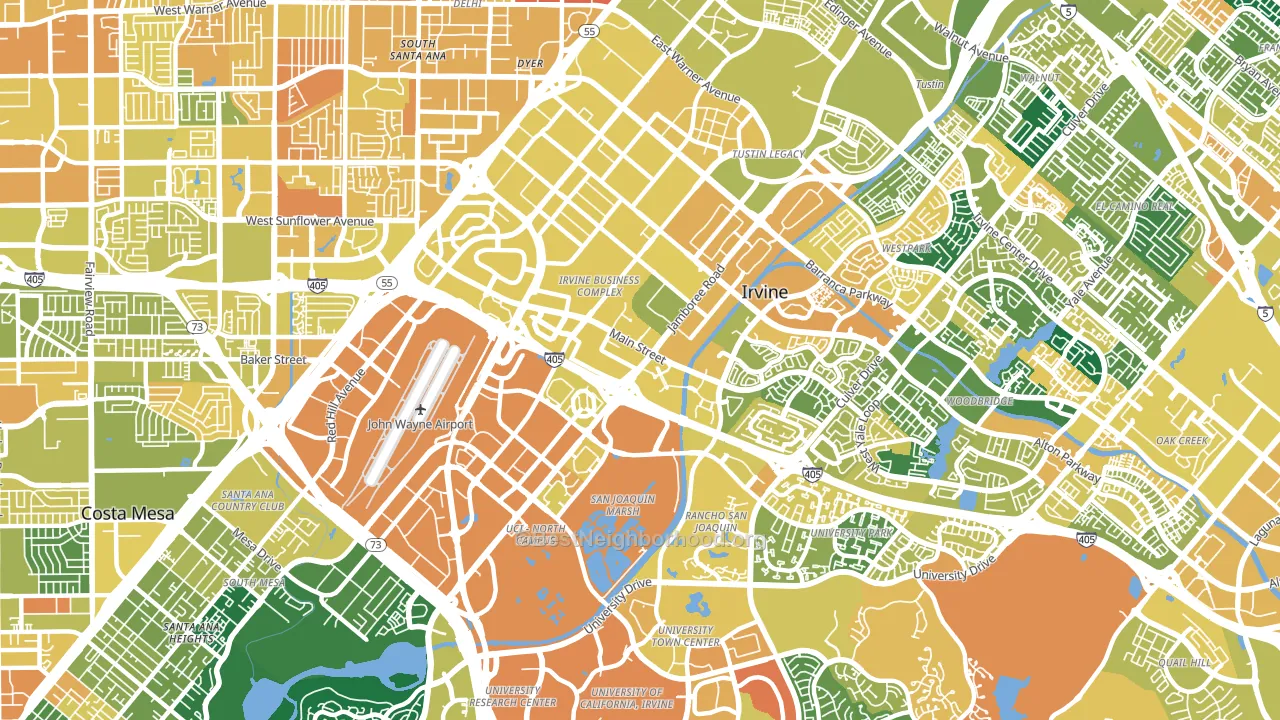
About 41% of adults in Irvine Business Complex typically vote, below the U.S. average of about 62%. Among adults in Irvine Business Complex, ~23% vote Democratic, ~19% Republican, and ~58% don't vote. The map below shows estimated turnout by block group.
How Irvine Business Complex compares
Among neighborhoods within 5 miles, Irvine Business Complex leans more Democratic than 4 of 34 neighbors.
Irvine Business Complex runs about 9 points more Republican than California as a whole.
Politics vary noticeably by block within Irvine Business Complex. The northwest side is the most Democratic-leaning (D+28) and the southwest side is the least Democratic-leaning (D+6), a spread of about 22 points.
Why Irvine Business Complex leans the way it does
This analysis examined 14,881 data points per neighborhood to find what predicts political lean and turnout. The items below are a few correlations that stood out for Irvine Business Complex, not a ranked or complete list of what matters most.
Areas with high college attainment vote Democratic. About 60% of adults in Irvine Business Complex hold a bachelor's degree, about 31 points above the U.S. average of 28%. A high never-married share predicts Democratic voting, and about 54% of adults in Irvine Business Complex have never been married, above 87% of neighborhoods.
Walkability and Democratic lean
Places with a highly walkable street grid tend to lean Democratic; Irvine Business Complex, Irvine, CA sits in the top quarter nationally on this measure. A walkable street grid does not change how people vote; it mostly reflects how urban a place is.
Why turnout in Irvine Business Complex looks the way it does
Renters vote less often than owners. About 77% of households in Irvine Business Complex rent, about 52 points above the U.S. average of 25%. Learn more about the findings and methodology on the political spectrum map.
Nearby Neighborhoods
- Business District, Irvine, CA D+16
- Rancho San Joaquin, Irvine, CA D+33
- West Park, Irvine, CA D+14
- University Town Center, Irvine, CA D+33
- University Park, Irvine, CA D+16
- Sandpointe, Santa Ana, CA D+23
- Woodbridge, Irvine, CA D+9
- UC Irvine, Irvine, CA D+70
- South Coast, Santa Ana, CA D+24
- Delhi, Santa Ana, CA D+33
Neighborhoods with Similar Populations
- University Park-San Antonio, San Antonio, TX D+30
- Downtown La Porte, La Porte, TX R+25
- Martindale-Brightwood, Indianapolis, IN D+66
- The Islands, Gilbert, AZ R+5
- Lansdowne, Charlotte, NC D+29
- Arlington South, Riverside, CA R+2
- Cotswold, Charlotte, NC D+25
- Staumbaugh Heller, Redwood City, CA D+51
- Tampa Heights, Tampa, FL D+53
- Belknap Lookout, Grand Rapids, MI D+50
Sources and methodology
Precinct-level voting records used to fit the model come from California Secretary of State, Elections, distributed by the Voting and Election Science Team. Demographic inputs come from the U.S. Census Bureau (ACS 5-year estimates and the 2020 Decennial Census). Health and environmental inputs come from the CDC (PLACES and the Environmental Justice Index). Land cover comes from the USGS and EPA. Election-day and lead-up weather come from PRISM 4km daily grids and the NOAA Global Historical Climatology Network. Mail-voting and election-administration patterns come from the MIT Election Lab's Survey of the Performance of American Elections. Block-group crime detail comes from CrimeGrade. Internet data and modeling support provided by ISPreports.org.
Modeling and analysis by the BestNeighborhood data science team. Full methodology and findings: political spectrum map.
Methodology reviewed by the BestNeighborhood data team. Last updated May 2026.